which graph shows the line of best fit?
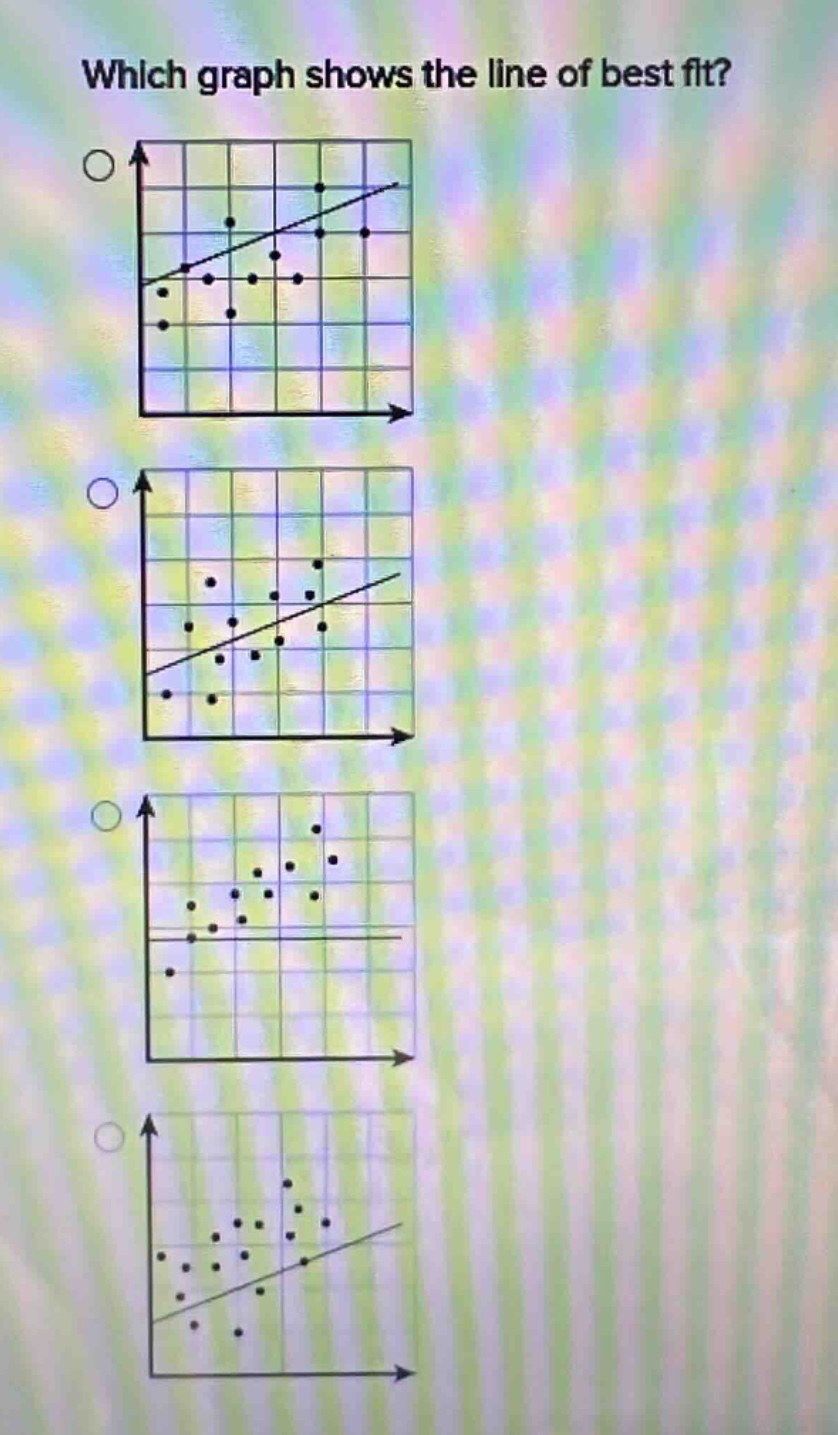
which graph shows the line of best fit?
Answer
Explanation:
Step1: Recall line - of - best - fit concept
The line of best fit is a straight line that minimizes the distance between the line and the data points in a scatter - plot. It should pass through the "center" of the data points.
Step2: Analyze each graph
In the first graph, the line seems to pass through the general area where most of the data points are concentrated. In the second graph, the line does not seem to be in the middle of the data points. In the third graph, the horizontal line does not capture the upward trend of the data. In the fourth graph, the line does not seem to be in the best position to represent the overall pattern of the data.
Answer:
The first graph (the top - most graph) shows the line of best fit.