the graph shows the low and high temperatures each day in a city for two weeks. temperature the line of best…
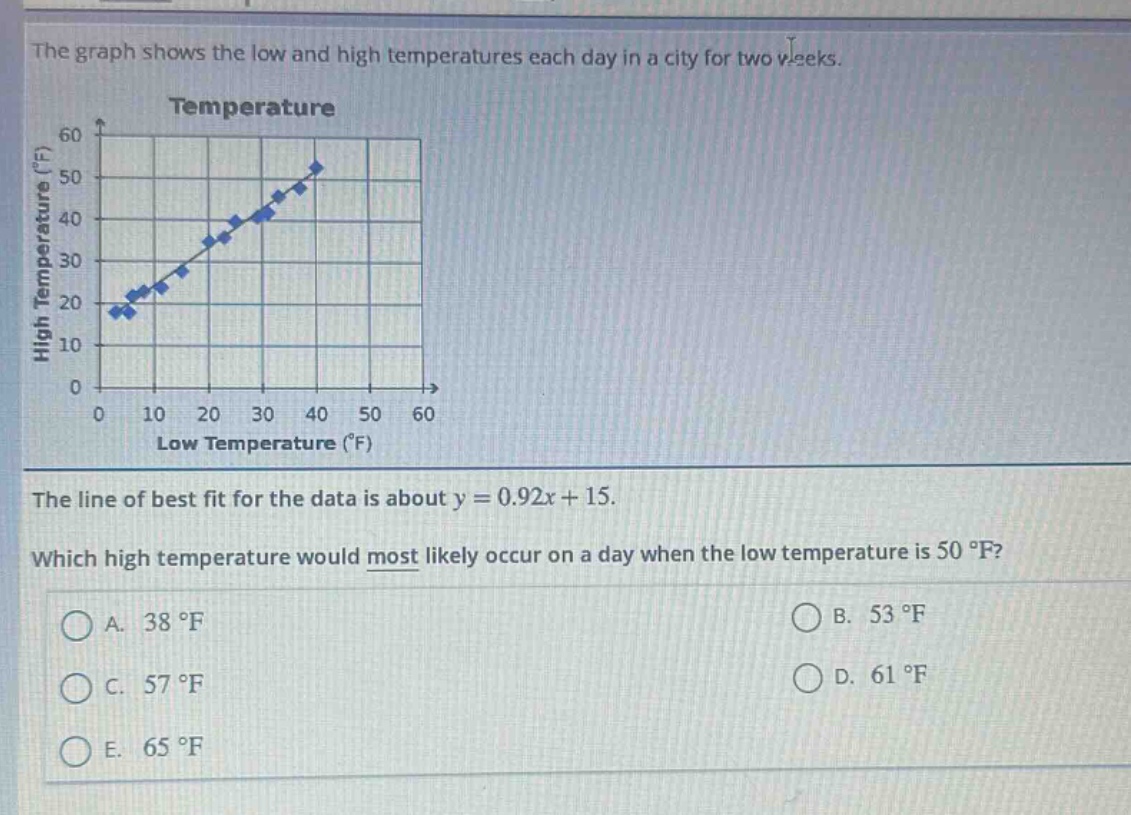
the graph shows the low and high temperatures each day in a city for two weeks. temperature the line of best fit for the data is about y = 0.92x + 15. which high temperature would most likely occur on a day when the low temperature is 50 °f? a. 38 °f b. 53 °f c. 57 °f d. 61 °f e. 65 °f
Answer
Explanation:
Step1: Identify the variables
The equation of the line of best - fit is $y = 0.92x+15$, where $x$ is the low temperature and $y$ is the high temperature.
Step2: Substitute the value of $x$
We are given that $x = 50$. Substitute $x = 50$ into the equation $y=0.92x + 15$. $y=0.92\times50+15$
Step3: Perform the multiplication
$0.92\times50 = 46$. So, $y=46 + 15$.
Step4: Perform the addition
$y=61$.
Answer:
D. $61^{\circ}F$