which graph shows a negative correlation?
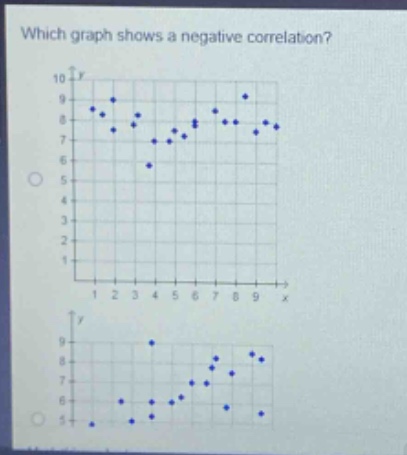
which graph shows a negative correlation?
Answer
Explanation:
Step1: Recall negative - correlation concept
In a negative - correlation, as the value of the independent variable ($x$) increases, the value of the dependent variable ($y$) generally decreases.
Step2: Analyze first graph
In the first graph, as $x$ increases from 1 to 9, the $y$ - values do not show a consistent decrease. There is no clear trend of $y$ decreasing as $x$ increases.
Step3: Analyze second graph
In the second graph, as $x$ increases from 1 to 9, the $y$ - values generally decrease. For example, when $x = 1$, $y$ is around 9, and as $x$ gets larger, $y$ gets smaller.
Answer:
The second graph shows a negative correlation.