this graph shows the number of cups of coffee (y) sold each day (x) at sals diner. which data set represents…
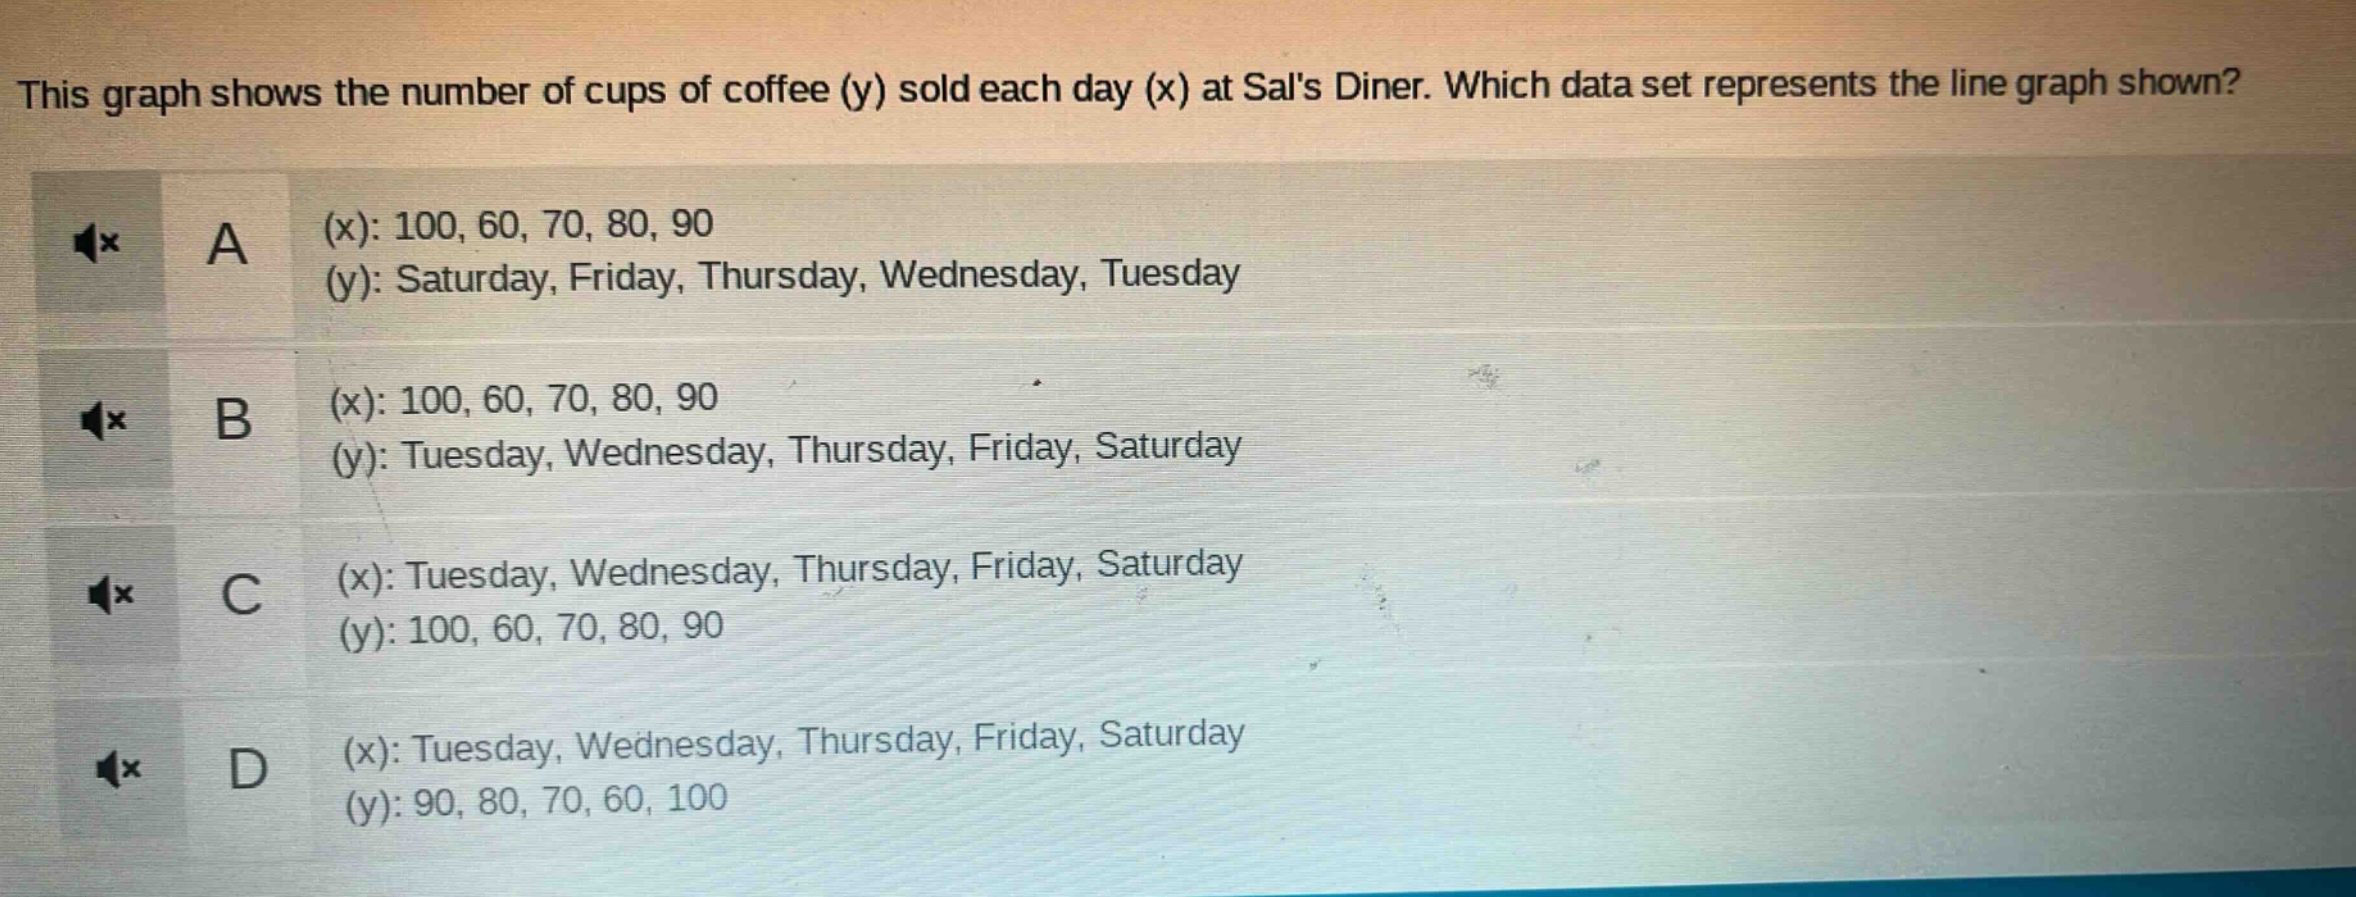
this graph shows the number of cups of coffee (y) sold each day (x) at sals diner. which data set represents the line graph shown? a (x): 100, 60, 70, 80, 90 (y): saturday, friday, thursday, wednesday, tuesday b (x): 100, 60, 70, 80, 90 (y): tuesday, wednesday, thursday, friday, saturday c (x): tuesday, wednesday, thursday, friday, saturday (y): 100, 60, 70, 80, 90 d (x): tuesday, wednesday, thursday, friday, saturday (y): 90, 80, 70, 60, 100
Answer
Explanation:
Step1: Identify x - variable and y - variable
The x - variable is the day and y - variable is the number of cups of coffee sold.
Step2: Check the order of variables in options
In a data - set for a graph, the independent variable (day) should be in the x - list and the dependent variable (number of cups of coffee) should be in the y - list.
Step3: Analyze each option
Options A and B have the day in the y - list which is incorrect. Option D has an incorrect order of the number of cups of coffee values. Option C has the days (Tuesday, Wednesday, Thursday, Friday, Saturday) in the x - list and the number of cups of coffee (100, 60, 70, 80, 90) in the y - list which is correct for representing the line graph where x is the day and y is the number of cups of coffee sold.
Answer:
C. (x): Tuesday, Wednesday, Thursday, Friday, Saturday; (y): 100, 60, 70, 80, 90