the graph shows the number of minutes, to the nearest five minutes, that sarah spent getting ready for…
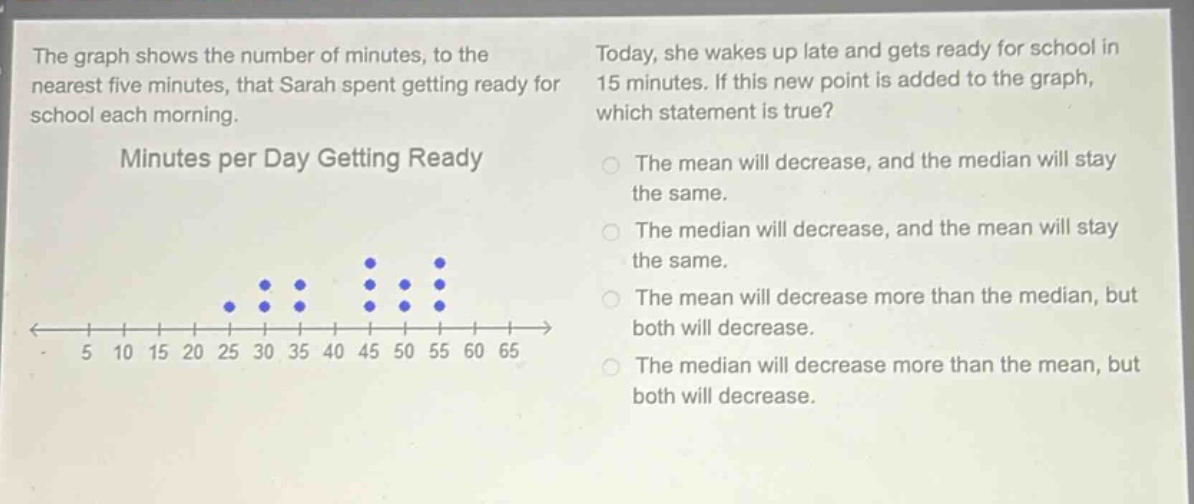
the graph shows the number of minutes, to the nearest five minutes, that sarah spent getting ready for school each morning. today, she wakes up late and gets ready for school in 15 minutes. if this new point is added to the graph, which statement is true? minutes per day getting ready the mean will decrease, and the median will stay the same. the median will decrease, and the mean will stay the same. the mean will decrease more than the median, but both will decrease. the median will decrease more than the mean, but both will decrease.
Answer
Explanation:
Step1: List the original data points from the dot plot.
The data points are: 25, 30, 35, 35, 45, 45, 45, 50, 50, 55, 55, 55. There are $n=12$ data points.
Step2: Calculate the original mean.
$$ \text{Mean}{\text{original}} = \frac{25 + 30 + 2(35) + 3(45) + 2(50) + 3(55)}{12} $$ $$ \text{Mean}{\text{original}} = \frac{25 + 30 + 70 + 135 + 100 + 165}{12} = \frac{525}{12} = 43.75 $$
Step3: Calculate the original median.
Order the data: 25, 30, 35, 35, 45, 45, 45, 50, 50, 55, 55, 55. Since $n=12$ (even), the median is the average of the 6th and 7th values. $$ \text{Median}_{\text{original}} = \frac{45 + 45}{2} = 45 $$
Step4: Add the new data point (15) to the dataset.
The new data set is: 15, 25, 30, 35, 35, 45, 45, 45, 50, 50, 55, 55, 55. There are now $n=13$ data points.
Step5: Calculate the new mean.
$$ \text{Mean}_{\text{new}} = \frac{525 + 15}{13} = \frac{540}{13} \approx 41.54 $$
Step6: Calculate the new median.
Order the new data: 15, 25, 30, 35, 35, 45, 45, 45, 50, 50, 55, 55, 55. Since $n=13$ (odd), the median is the middle value, which is the 7th value. $$ \text{Median}_{\text{new}} = 45 $$
Step7: Compare the original and new mean and median.
The mean decreased from 43.75 to approximately 41.54. The median remained the same at 45.
Answer:
The mean will decrease, and the median will stay the same.