the graph shows a probability distribution. what is $p(1.5leq xleq4.5)$? enter your answer, as a decimal, in…
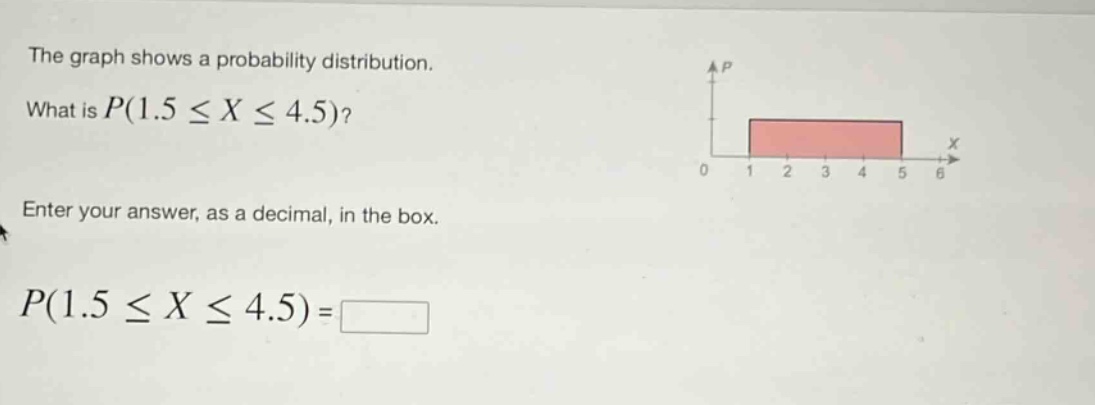
the graph shows a probability distribution. what is $p(1.5leq xleq4.5)$? enter your answer, as a decimal, in the box. $p(1.5leq xleq4.5)=square$
Answer
Explanation:
Step1: Determine base and height
The base of the rectangle in the probability - distribution graph for the interval we care about is from (x = 1.5) to (x = 4.5), so the base (b=4.5 - 1.5=3). Since the total area under a probability - distribution graph is 1 and the rectangle extends from (x = 1) to (x = 5) (a base of (5 - 1 = 4)), and assuming the height (h) is constant over the interval ([1,5]), and the area (A = 1) for the whole rectangle from (x = 1) to (x = 5), and (A=bh), then (h=\frac{1}{4}).
Step2: Calculate the area of the sub - rectangle
The area of a rectangle is (A = bh). We know (b = 3) and (h=\frac{1}{4}), so (A=3\times\frac{1}{4}=0.75).
Answer:
(0.75)