the graph shows the relationship between the price of frozen yogurt and the number of ounces of frozen…
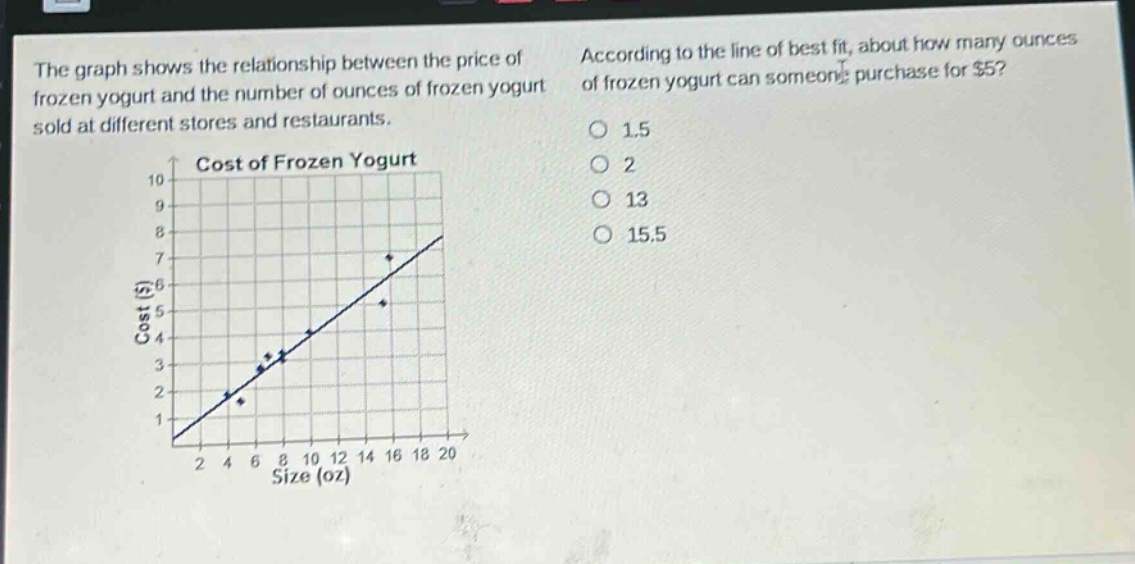
the graph shows the relationship between the price of frozen yogurt and the number of ounces of frozen yogurt sold at different stores and restaurants. according to the line of best fit, about how many ounces of frozen yogurt can someone purchase for $5? 1.5 2 13 15.5 cost of frozen yogurt 10 9 8 7 6 5 cost ($) 4 3 2 1 2 4 6 8 10 12 14 16 18 20 size (oz)
Answer
Explanation:
Step1: Locate $y = 5$ on graph
Find the $y$-value of 5 on the cost - axis.
Step2: Read corresponding $x$-value
Move horizontally from $y = 5$ to the line of best - fit, then vertically down to read the $x$-value on the size - axis. The $x$-value is approximately 13.
Answer:
13