the graph below shows a set of data and the line of best fit. complete the sentence to make a true…
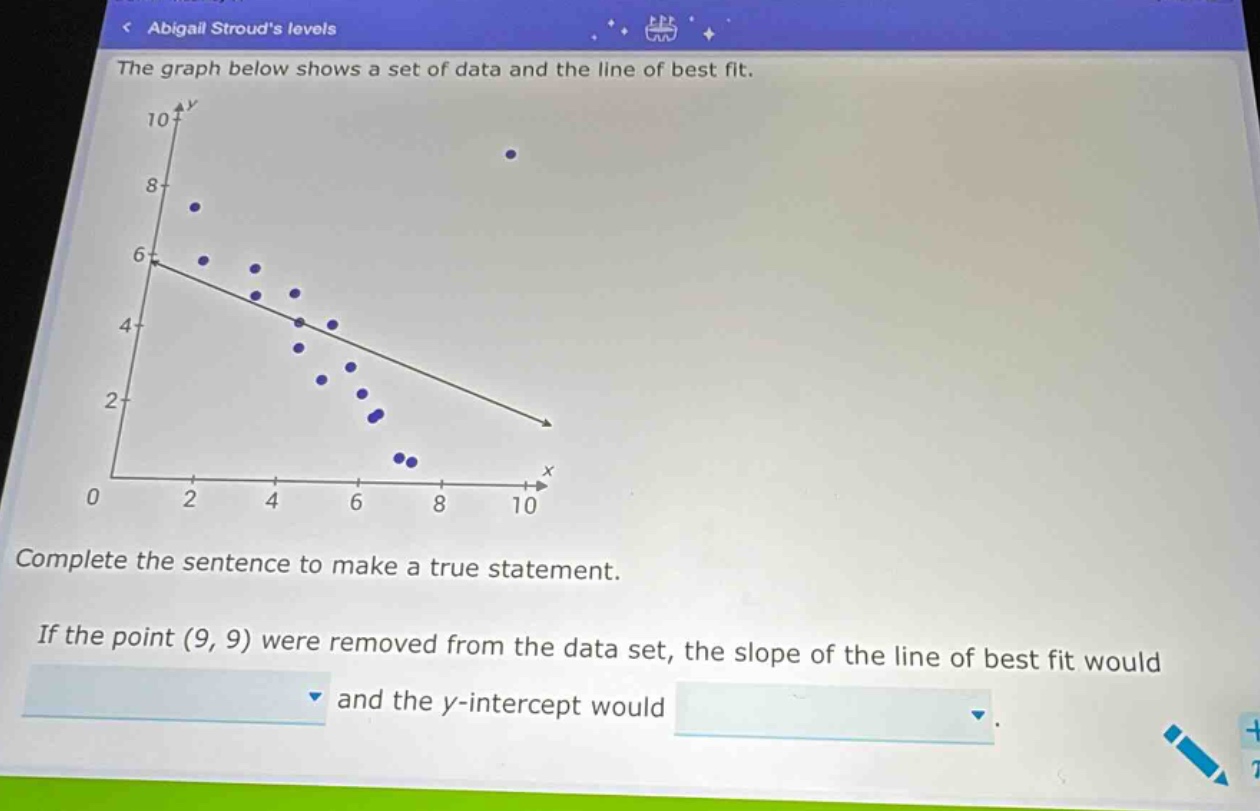
the graph below shows a set of data and the line of best fit. complete the sentence to make a true statement. if the point (9, 9) were removed from the data set, the slope of the line of best fit would and the y - intercept would
Answer
Explanation:
Step1: Analyze the out - lier effect
The point (9, 9) is an out - lier above the general trend of the data.
Step2: Consider slope change
Removing an out - lier that is above the trend will make the line of best fit steeper in the negative direction, so the slope will decrease (become more negative).
Step3: Consider y - intercept change
With the slope becoming more negative and the line adjusting to fit the remaining data better, the y - intercept will increase.
Answer:
The slope of the line of best fit would decrease and the y - intercept would increase.