the graph below shows two normal distributions. what is the difference of the means of the distributions? 15…
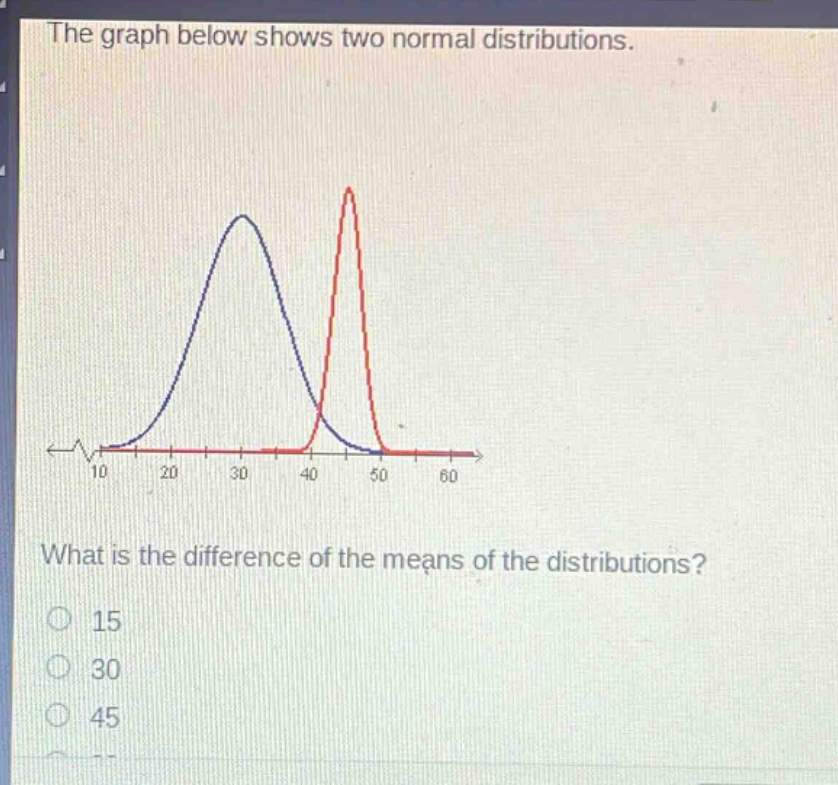
the graph below shows two normal distributions. what is the difference of the means of the distributions? 15 30 45
Answer
Explanation:
Step1: Identify the means
The mean of a normal - distribution is at the center of the bell - shaped curve. The blue curve has a mean around 30 and the red curve has a mean around 45.
Step2: Calculate the difference
The difference of the means is (45 - 30). (45-30 = 15)
Answer:
15