the graph shows the weight and fuel efficiency, in miles per gallon, for a selection of vehicles. which is…
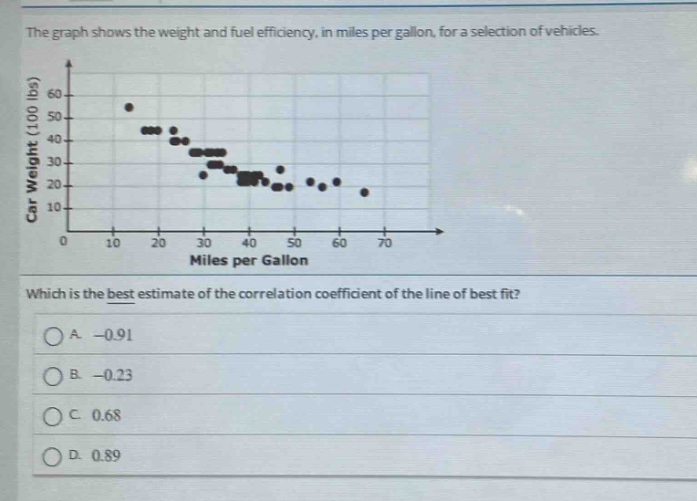
the graph shows the weight and fuel efficiency, in miles per gallon, for a selection of vehicles. which is the best estimate of the correlation coefficient of the line of best fit? a. -0.91 b. -0.23 c. 0.68 d. 0.89
Answer
Explanation:
Step1: Observe the scatter - plot trend
The scatter - plot shows that as the miles per gallon (x - variable) increases, the car weight (y - variable) decreases. This indicates a negative correlation.
Step2: Analyze the strength of the correlation
The points in the scatter - plot are closely clustered around a line. A strong negative correlation has a correlation coefficient close to - 1.
Answer:
A. -0.91