the graph below is used by company 2 to show the average monthly electric cost based on the electricity…
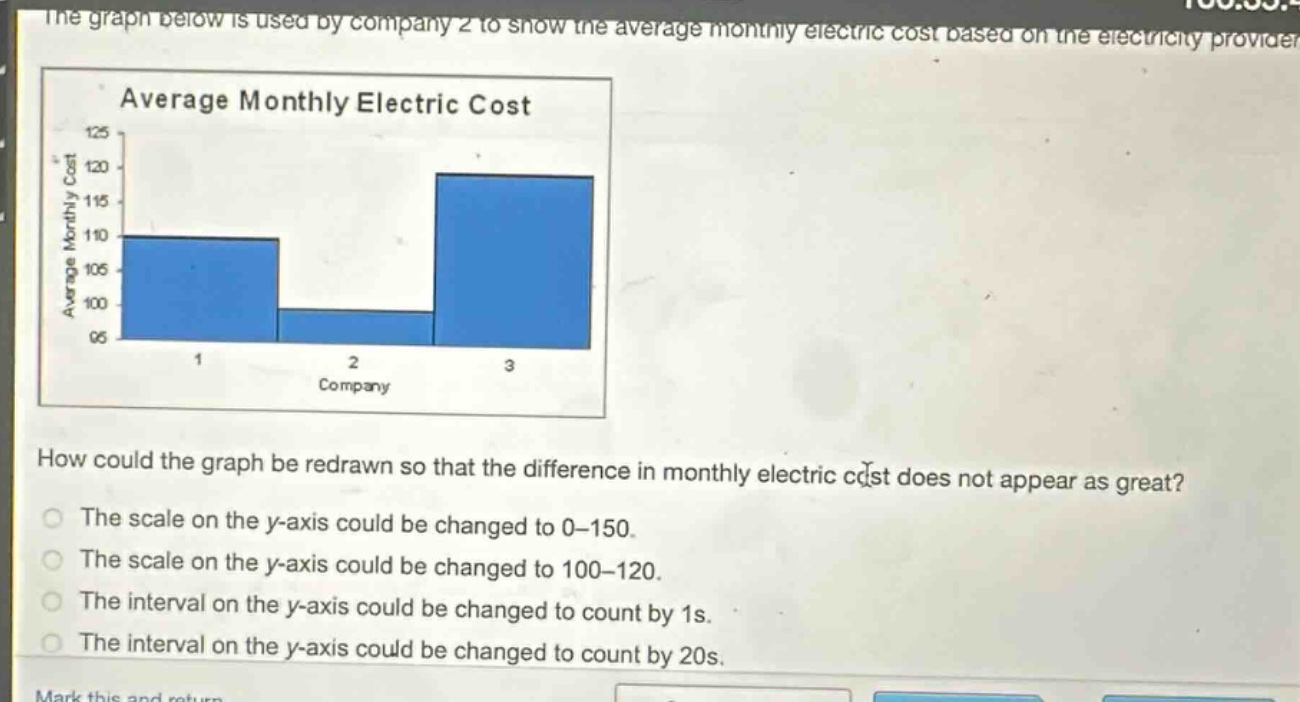
the graph below is used by company 2 to show the average monthly electric cost based on the electricity provider.\naverage monthly electric cost\nhow could the graph be redrawn so that the difference in monthly electric cost does not appear as great?\nthe scale on the y - axis could be changed to 0–150.\nthe scale on the y - axis could be changed to 100–120.\nthe interval on the y - axis could be changed to count by 1s.\nthe interval on the y - axis could be changed to count by 20s.
Answer
Explanation:
Step1: Analyze the effect of y - axis scale
When the range of the y - axis is smaller, differences in data values appear more pronounced. To make the difference in monthly electric costs less apparent, we need to increase the range of the y - axis.
Step2: Evaluate each option
- Option 1: Changing the y - axis scale to 0 - 150 increases the range. This will make the differences between the bar - heights (representing costs) seem smaller compared to the current scale.
- Option 2: Changing to 100 - 120 decreases the range, making differences more pronounced.
- Option 3: Changing the interval to count by 1s doesn't change the overall range and may just make the graph look more detailed but not reduce the apparent difference.
- Option 4: Changing the interval to count by 20s doesn't change the overall range in a way that reduces the apparent difference as effectively as changing the range to 0 - 150.
Answer:
The scale on the y - axis could be changed to 0 - 150.