which of these graphs best represents a line of best fit for the point shown?
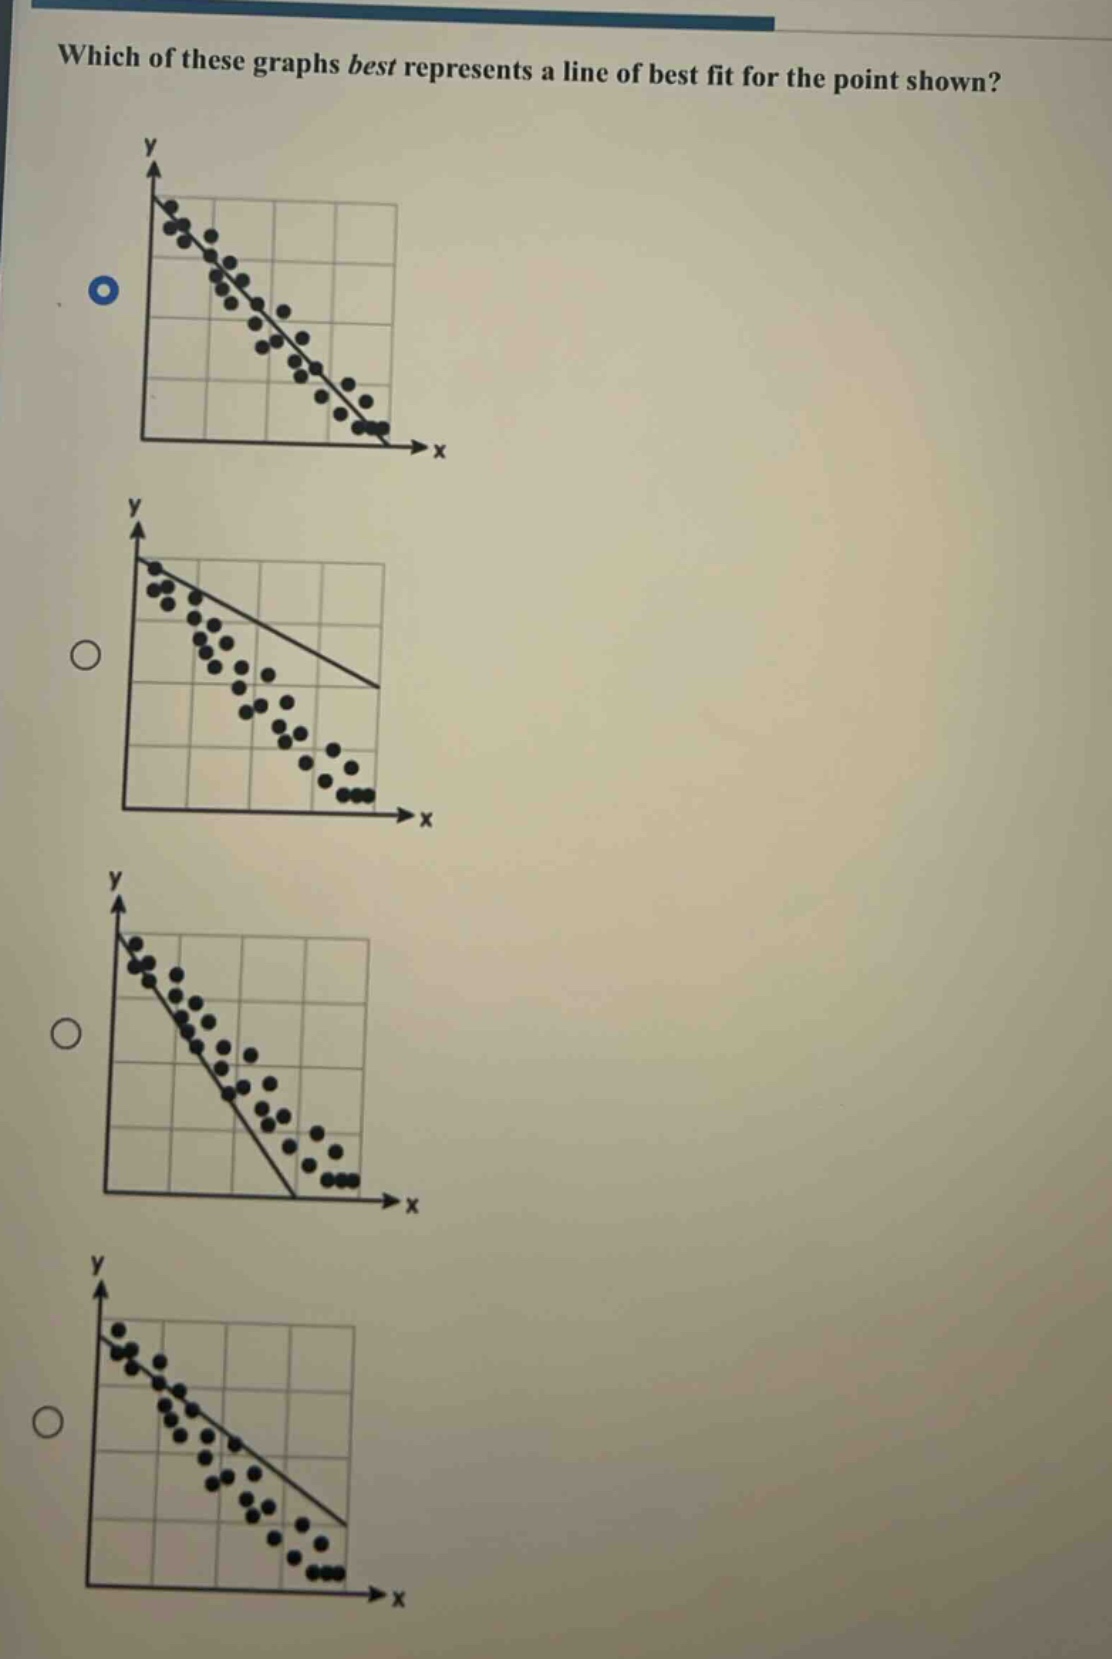
which of these graphs best represents a line of best fit for the point shown?
Answer
Explanation:
Step1: Recall line - of - best - fit concept
A line of best fit is a straight line that best represents the data on a scatter - plot. It should pass as close as possible to most of the data points.
Step2: Analyze each graph
In the first graph, the line passes very close to most of the points. In the second graph, the line does not seem to capture the overall trend well as there are many points far from it. In the third graph, the line does not fit the data as well as the first one since some points are relatively far from it. In the fourth graph, the line also does not represent the data as accurately as the first one with several points being off - set from the line.
Answer:
The first graph (the one with the blue - circled option in the image) best represents the line of best fit.