the graphs shape is best described as skewed. complete which of the following statements would you expect to…
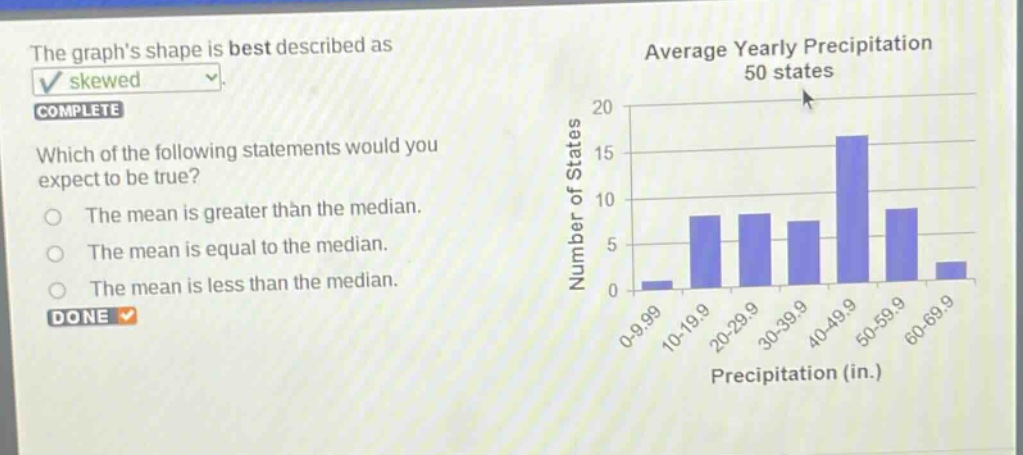
the graphs shape is best described as skewed. complete which of the following statements would you expect to be true? the mean is greater than the median. the mean is equal to the median. the mean is less than the median. done average yearly precipitation 50 states number of states 20 15 10 5 0 0 - 9.99 10 - 19.9 20 - 29.9 30 - 39.9 40 - 49.9 50 - 59.9 60 - 69.9 precipitation (in.)
Answer
Brief Explanations:
The provided histogram shows the distribution of average yearly precipitation for 50 states. The shape of the distribution is skewed. To determine the relationship between the mean and the median, we observe the direction of the skewness. The tail of the distribution extends towards the lower values (left side), indicating that the distribution is skewed to the left. In a left-skewed distribution, the mean is pulled towards the lower values in the tail, making it less than the median. Therefore, we expect the mean precipitation to be less than the median precipitation.
Answer:
The mean is less than the median.