the graphs shape is best described as skewed. complete which of the following statements would you expect to…
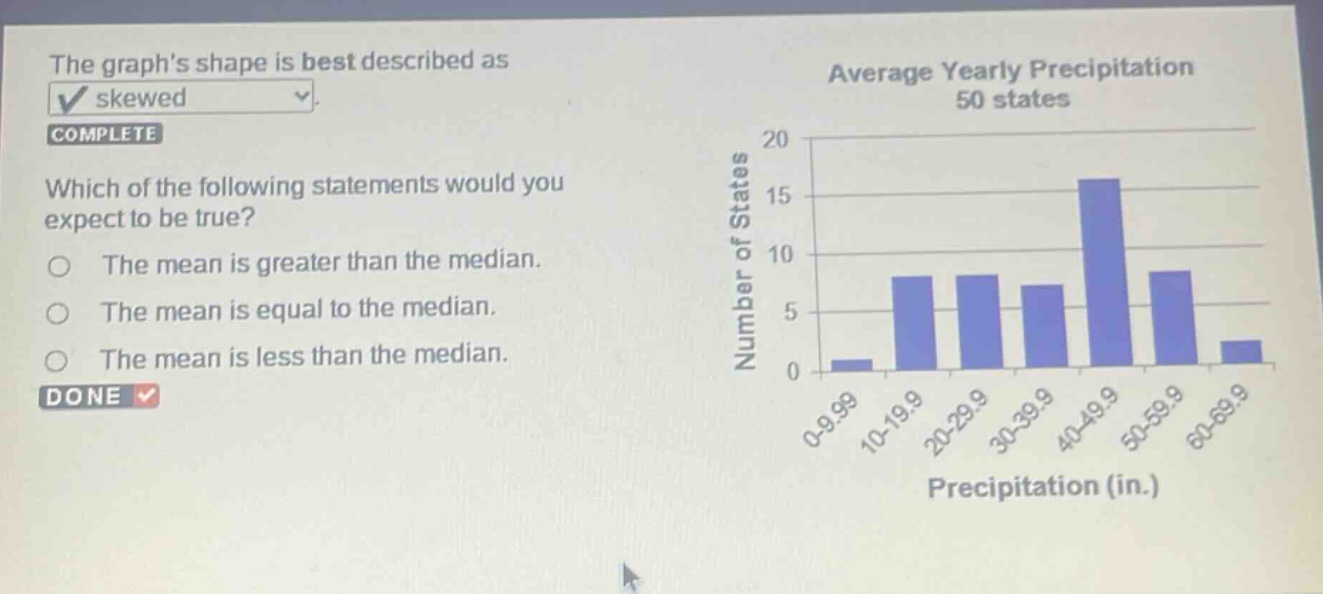
the graphs shape is best described as skewed. complete which of the following statements would you expect to be true? the mean is greater than the median. the mean is equal to the median. the mean is less than the median. done
Answer
Explanation:
Step1: Analyze the skewness
The histogram is right - skewed. In a right - skewed distribution, the tail is on the right side.
Step2: Recall the relationship
In a right - skewed distribution, the mean is pulled in the direction of the tail. So, the mean is greater than the median.
Answer:
The mean is greater than the median.