why are graphs useful when interpreting data?\nthey make trends in the data easier to see.\nthey are easier…
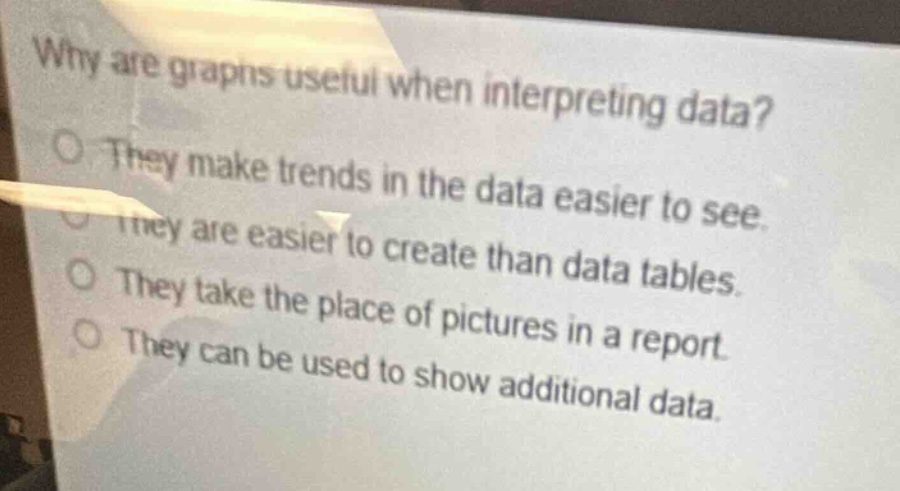
why are graphs useful when interpreting data?\nthey make trends in the data easier to see.\nthey are easier to create than data tables.\nthey take the place of pictures in a report.\nthey can be used to show additional data.
Answer
Brief Explanations:
Graphs visually represent data, making it simpler to identify patterns, trends, and relationships. They are not necessarily easier to create than data - tables, don't replace pictures in reports, and aren't mainly about showing additional data. The key advantage is highlighting trends.
Answer:
They make trends in the data easier to see.