green valley middle school recorded the number of students in each homeroom. number of students 20 24 22 24…
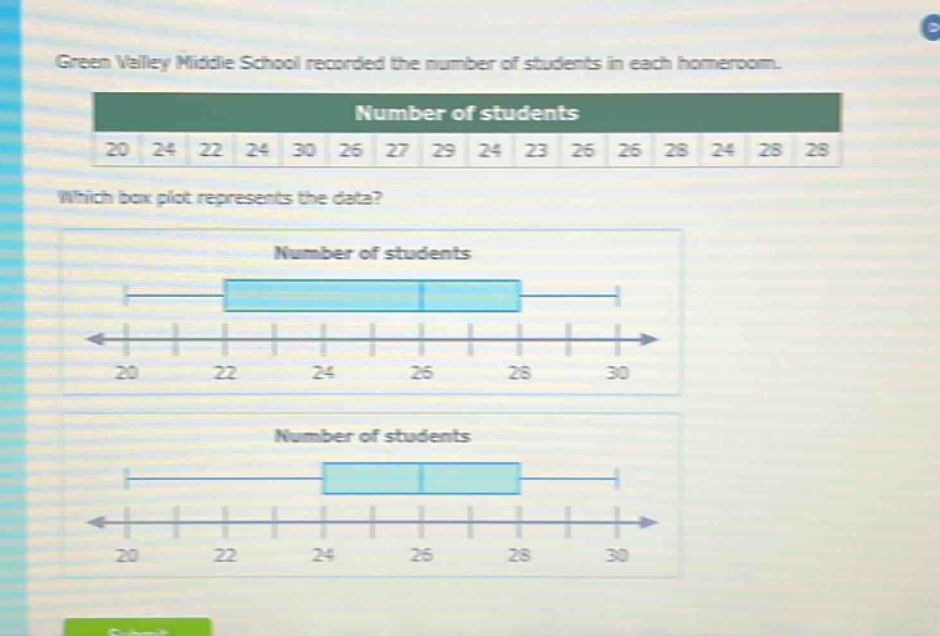
green valley middle school recorded the number of students in each homeroom. number of students 20 24 22 24 30 26 27 29 24 23 26 26 28 24 28 28 which box - plot represents the data? number of students 20 22 24 26 28 30 number of students 20 22 24 26 28 30
Answer
Explanation:
Step1: Arrange data in ascending order
20, 22, 23, 24, 24, 24, 24, 26, 26, 26, 27, 28, 28, 28, 29, 30
Step2: Find the minimum value
The minimum value is 20.
Step3: Find the first - quartile ($Q_1$)
There are 16 data points. The position of $Q_1$ is $\frac{16 + 1}{4}=4.25$. So, $Q_1$ is the value between the 4th and 5th ordered data points. $Q_1=\frac{24 + 24}{2}=24$.
Step4: Find the median ($Q_2$)
The position of the median is $\frac{16}{2}=8$ and $\frac{16}{2}+ 1 = 9$. So, $Q_2=\frac{26+26}{2}=26$.
Step5: Find the third - quartile ($Q_3$)
The position of $Q_3$ is $3\times\frac{16 + 1}{4}=12.75$. So, $Q_3$ is the value between the 12th and 13th ordered data points. $Q_3=\frac{28+28}{2}=28$.
Step6: Find the maximum value
The maximum value is 30.
The box - plot should have a minimum value of 20, $Q_1 = 24$, median = 26, $Q_3=28$ and maximum value of 30.
Answer:
The box - plot with the minimum at 20, the left - hand side of the box at 24, the line in the box at 26, the right - hand side of the box at 28 and the maximum at 30. (The first box - plot shown in the image if we assume the order of presentation is from top to bottom).