greg teaches an art class. the table below shows how many drawings his students had submitted by last…
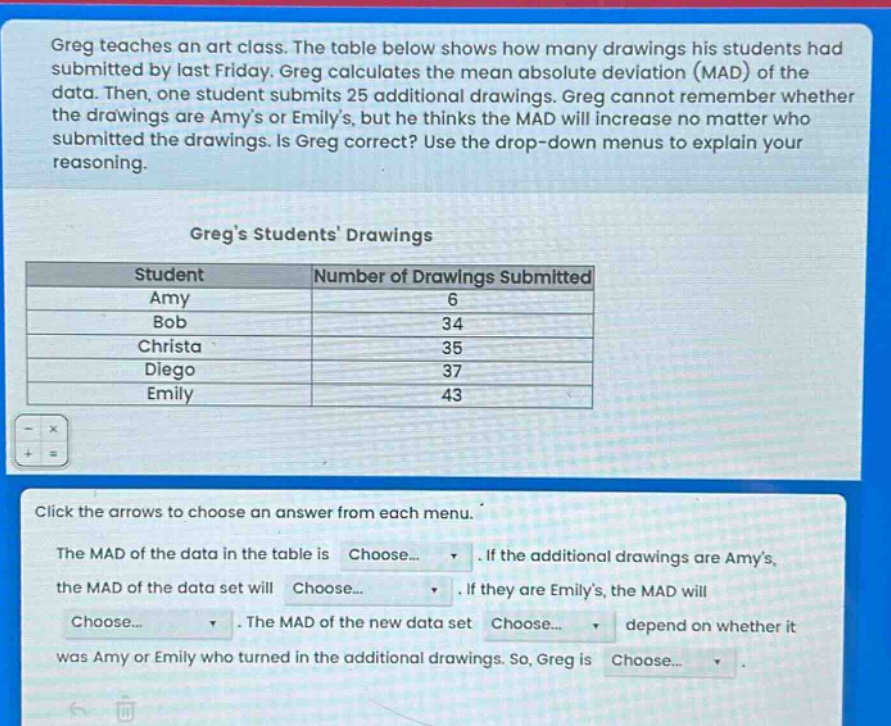
greg teaches an art class. the table below shows how many drawings his students had submitted by last friday. greg calculates the mean absolute deviation (mad) of the data. then, one student submits 25 additional drawings. greg cannot remember whether the drawings are amys or emilys, but he thinks the mad will increase no matter who submitted the drawings. is greg correct? use the drop - down menus to explain your reasoning.\n\ngregs students drawings\n\n| student | number of drawings submitted |\n| ---- | ---- |\n| amy | 6 |\n| bob | 34 |\n| christa | 35 |\n| diego | 37 |\n| emily | 43 |\n\nclick the arrows to choose an answer from each menu.\n\nthe mad of the data in the table is choose... . if the additional drawings are amys, the mad of the data set will choose... . if they are emilys, the mad will choose... . the mad of the new data set choose... depend on whether it was amy or emily who turned in the additional drawings. so, greg is choose... .
Answer
Explanation:
Step1: Calculate the mean of the original data set
The original data set is (6,34,35,37,43). The mean (\bar{x}=\frac{6 + 34+35+37+43}{5}=\frac{155}{5}=31).
Step2: Calculate the absolute - deviations of the original data set
(\vert6 - 31\vert=25), (\vert34 - 31\vert = 3), (\vert35 - 31\vert=4), (\vert37 - 31\vert = 6), (\vert43 - 31\vert=12).
Step3: Calculate the MAD of the original data set
The MAD of the original data set is (\frac{25+3+4+6+12}{5}=\frac{50}{5}=10).
Step4: Consider the case if the additional drawings are Amy's
If the additional drawings are Amy's, the new data set for Amy is (6 + 25=31). The new mean (\bar{x}_{new}=\frac{31+34+35+37+43}{5}=\frac{180}{5}=36). The absolute - deviations are (\vert31 - 36\vert = 5), (\vert34 - 36\vert=2), (\vert35 - 36\vert = 1), (\vert37 - 36\vert=1), (\vert43 - 36\vert = 7). The new MAD is (\frac{5+2+1+1+7}{5}=\frac{16}{5}=3.2), so the MAD decreases.
Step5: Consider the case if the additional drawings are Emily's
If the additional drawings are Emily's, the new data set for Emily is (43+25 = 68). The new mean (\bar{x}_{new}=\frac{6+34+35+37+68}{5}=\frac{180}{5}=36). The absolute - deviations are (\vert6 - 36\vert=30), (\vert34 - 36\vert = 2), (\vert35 - 36\vert=1), (\vert37 - 36\vert = 1), (\vert68 - 36\vert=32). The new MAD is (\frac{30+2+1+1+32}{5}=\frac{66}{5}=13.2), so the MAD increases.
Step6: Conclusion
The MAD of the new data set does depend on whether it was Amy or Emily who turned in the additional drawings.
Answer:
The MAD of the data in the table is (10). If the additional drawings are Amy's, the MAD of the data set will decrease. If they are Emily's, the MAD will increase. The MAD of the new data set does depend on whether it was Amy or Emily who turned in the additional drawings. So, Greg is incorrect.