a group of 55 football players was polled about which synthetic grass they like to play on, chemgrass or…
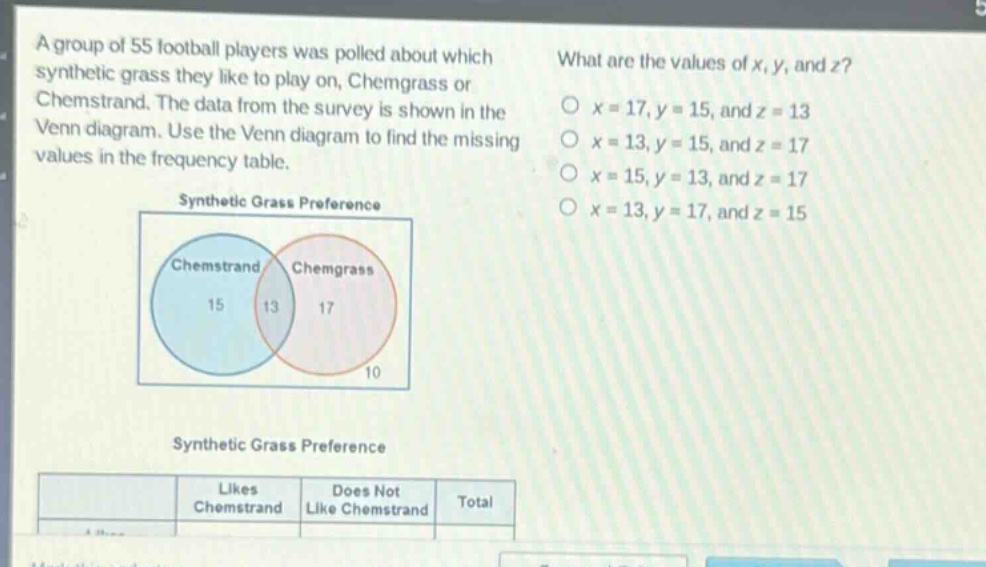
a group of 55 football players was polled about which synthetic grass they like to play on, chemgrass or chemstrand. the data from the survey is shown in the venn diagram. use the venn diagram to find the missing values in the frequency table. what are the values of x, y, and z? o x = 17, y = 15, and z = 13 o x = 13, y = 15, and z = 17 o x = 15, y = 13, and z = 17 o x = 13, y = 17, and z = 15 synthetic grass preference synthetic grass preference likes does not total chemstrand like chemstrand
Answer
Explanation:
Step1: Identify values from Venn - diagram
In the Venn - diagram, the number of players who like Chemstrand only is 15, the number of players who like both Chemstrand and Chemgrass is 13, and the number of players who like Chemgrass only is 17.
Step2: Match with variables
The value of (x) represents the number of players who like both Chemstrand and Chemgrass, so (x = 13). The value of (y) represents the number of players who like Chemgrass only, so (y=17). The value of (z) represents the number of players who like Chemstrand only, so (z = 15).
Answer:
(x = 13,y = 17,z = 15)