gwen volunteers in her schools lunchroom. for the past two weeks, she kept track of how many sixth - grade…
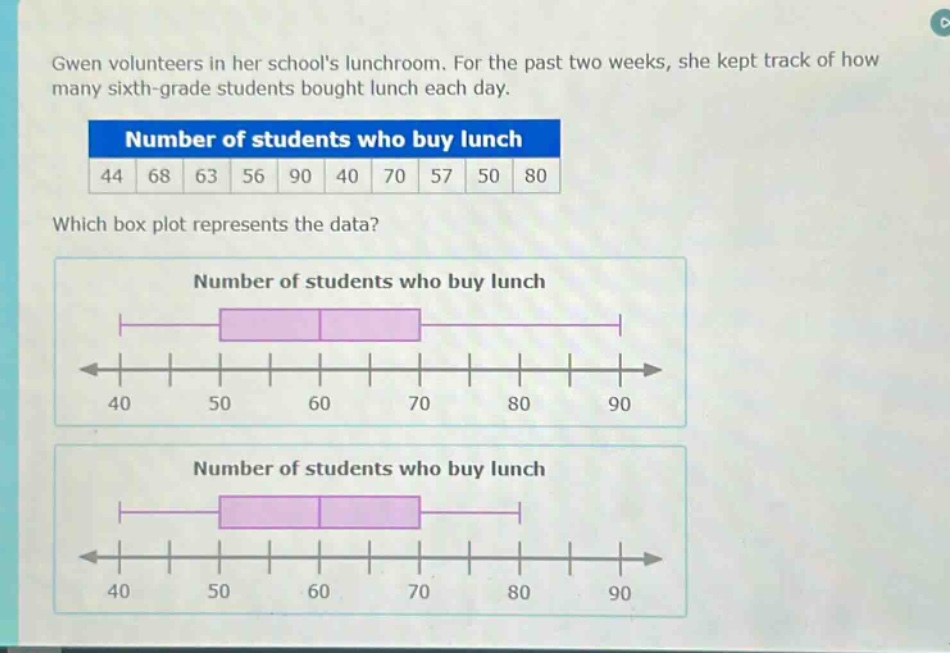
gwen volunteers in her schools lunchroom. for the past two weeks, she kept track of how many sixth - grade students bought lunch each day.\nnumber of students who buy lunch\n44 68 63 56 90 40 70 57 50 80\nwhich box plot represents the data?\nnumber of students who buy lunch\n40 50 60 70 80 90\nnumber of students who buy lunch\n40 50 60 70 80 90
Answer
Explanation:
Step1: Arrange data in ascending order
$40,44,50,56,57,63,68,70,80,90$
Step2: Find the median (Q2)
Since there are 10 data - points, the median is the average of the 5th and 6th ordered values. $\text{Q2}=\frac{57 + 63}{2}=60$
Step3: Find the lower half of data
The lower half is $40,44,50,56,57$. The median of the lower half (Q1) is 50.
Step4: Find the upper half of data
The upper half is $63,68,70,80,90$. The median of the upper half (Q3) is 70.
Step5: Identify the minimum and maximum
The minimum value is 40 and the maximum value is 90.
The box - plot should have a box from 50 (Q1) to 70 (Q3) with a line at 60 (Q2) inside the box, and whiskers extending to 40 (minimum) and 90 (maximum).
Answer:
The box - plot with a box from 50 to 70, a line at 60 inside the box, and whiskers extending to 40 and 90.