a health organization collects data on hospitals in a large metropolitan area. the scatterplot shows the…
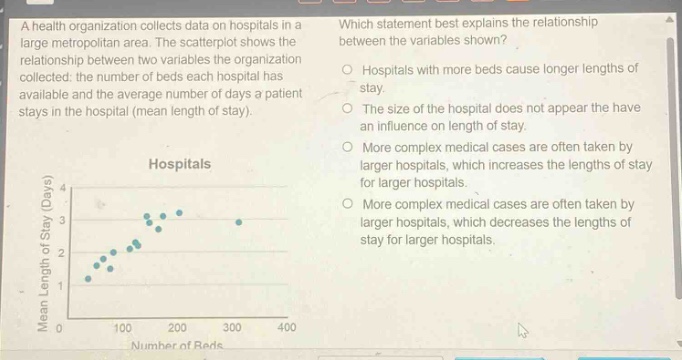
a health organization collects data on hospitals in a large metropolitan area. the scatterplot shows the relationship between two variables the organization collected: the number of beds each hospital has available and the average number of days a patient stays in the hospital (mean length of stay). which statement best explains the relationship between the variables shown? hospitals with more beds cause longer lengths of stay. the size of the hospital does not appear the have an influence on length of stay. more complex medical cases are often taken by larger hospitals, which increases the lengths of stay for larger hospitals. more complex medical cases are often taken by larger hospitals, which decreases the lengths of stay for larger hospitals.
Answer
Brief Explanations:
- Analyze each option:
- Option 1: Correlation does not imply causation. Just because there is a relationship in the scatter - plot does not mean that the number of beds "causes" the length of stay.
- Option 2: The scatter - plot shows a relationship (as the number of beds increases, the mean length of stay generally increases), so this option is incorrect.
- Option 3: A positive correlation is observed in the scatter - plot. Larger hospitals (more beds) likely take more complex cases. Complex cases may require longer hospital stays, which can explain the positive correlation.
- Option 4: The scatter - plot shows an increasing trend (positive correlation), so this option is incorrect.
Answer:
More complex medical cases are often taken by larger hospitals, which increases the lengths of stay for larger hospitals.