when hector opened his cupcake shop, he wanted to make sure his cupcakes were as fresh as possible. in the…
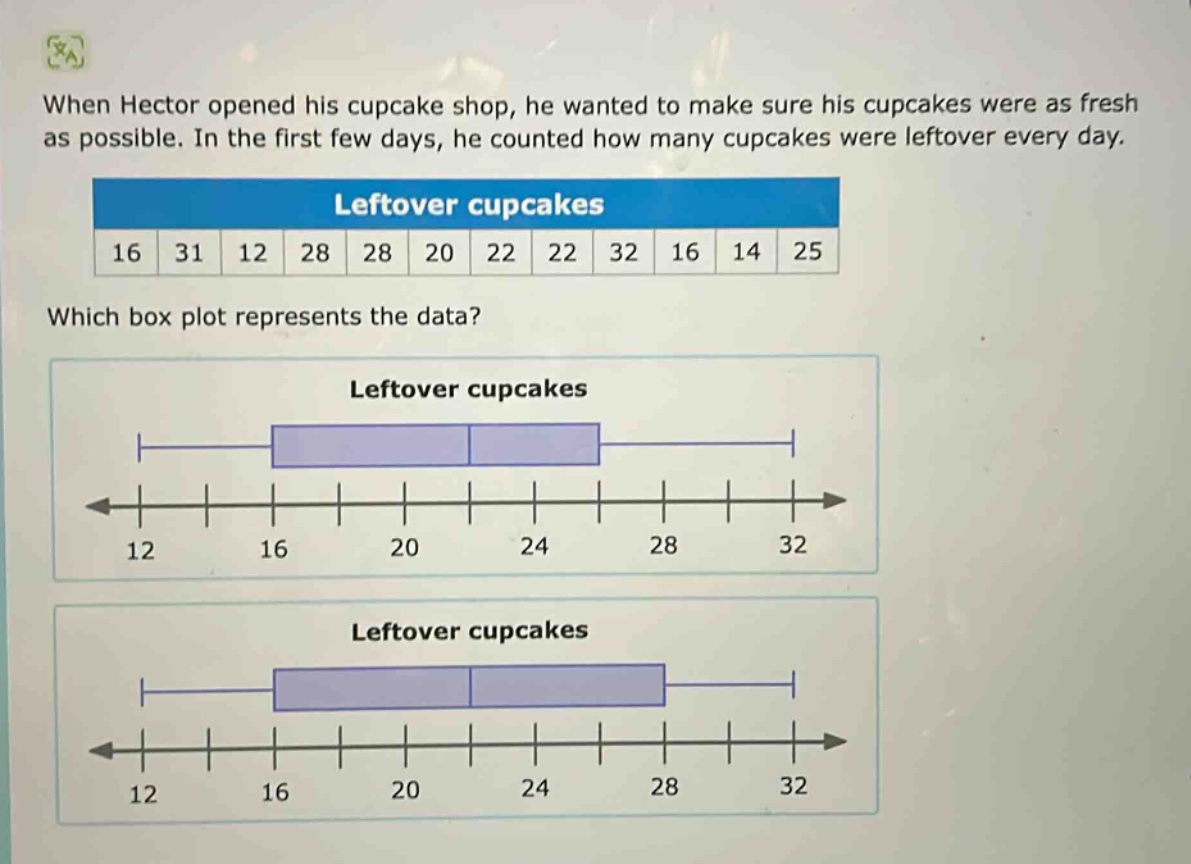
when hector opened his cupcake shop, he wanted to make sure his cupcakes were as fresh as possible. in the first few days, he counted how many cupcakes were leftover every day. leftover cupcakes 16 31 12 28 28 20 22 22 32 16 14 25 which box plot represents the data? leftover cupcakes 12 16 20 24 28 32 leftover cupcakes 12 16 20 24 28 32
Answer
Explanation:
Step1: Order the data
$12,14,16,16,20,22,22,25,28,28,31,32$
Step2: Find the minimum
The minimum value is $12$.
Step3: Find the first - quartile ($Q_1$)
There are $n = 12$ data points. The position of $Q_1$ is $\frac{n + 1}{4}=\frac{12+1}{4}=3.25$. So, $Q_1=\frac{16 + 16}{2}=16$.
Step4: Find the median ($Q_2$)
The position of the median is $\frac{n+1}{2}=\frac{12 + 1}{2}=6.5$. So, $Q_2=\frac{22+22}{2}=22$.
Step5: Find the third - quartile ($Q_3$)
The position of $Q_3$ is $\frac{3(n + 1)}{4}=\frac{3\times(12 + 1)}{4}=9.75$. So, $Q_3=\frac{28+28}{2}=28$.
Step6: Find the maximum
The maximum value is $32$.
Answer:
The box - plot with minimum at $12$, $Q_1$ at $16$, median at $22$, $Q_3$ at $28$ and maximum at $32$ represents the data. (Without seeing the full - fledged options, we describe the correct box - plot characteristics. If there were proper labeled options, we could directly pick the correct one based on these values).