the heights of the 40 trees in each of two forests are collected. forest a has a mean of 44.8 feet and a…
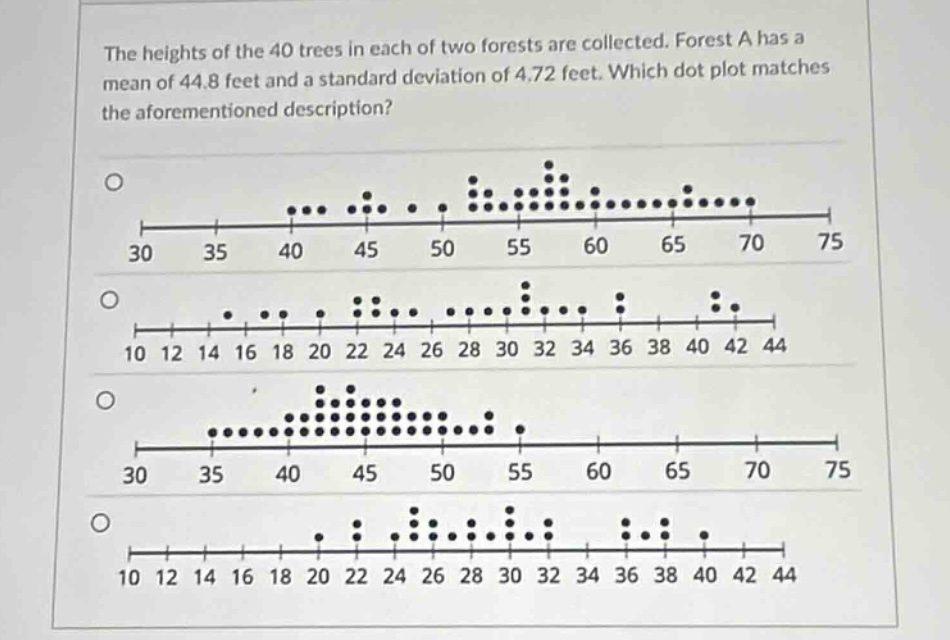
the heights of the 40 trees in each of two forests are collected. forest a has a mean of 44.8 feet and a standard deviation of 4.72 feet. which dot - plot matches the aforementioned description?
Answer
Explanation:
Step1: Identify the mean
The mean height of trees in Forest A is 44.8 feet. We should look for a dot - plot where the data is centered around 44.8.
Step2: Analyze the standard deviation
The standard deviation is 4.72 feet. This means that most of the data (about 68% in a normal distribution) should be within one - standard deviation of the mean, i.e., between (44.8 - 4.72=40.08) and (44.8 + 4.72 = 49.52) feet.
Step3: Evaluate the dot - plots
- The first dot - plot has data centered around 55 - 60, so it is not correct.
- The second and fourth dot - plots have data values mostly in the range of 10 - 44, which is far from the mean of 44.8.
- The third dot - plot has data centered around 45, and most of the data is in the range that is reasonable given the mean of 44.8 and standard deviation of 4.72.
Answer:
The third dot - plot (the one with data centered around 45 on the horizontal axis)