the heights, in feet, of 12 trees in a park are shown below.\n8, 11, 14, 16, 17, 21, 21, 24, 27, 31, 43…
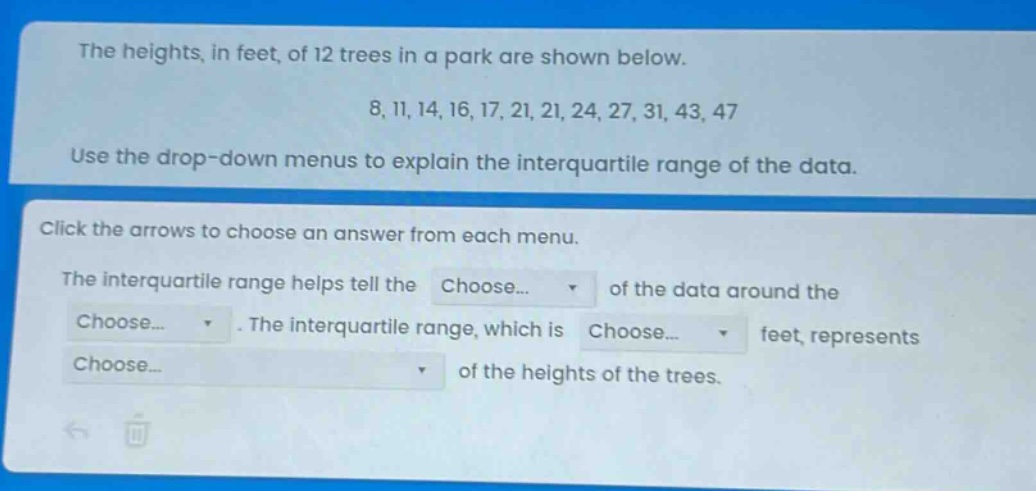
the heights, in feet, of 12 trees in a park are shown below.\n8, 11, 14, 16, 17, 21, 21, 24, 27, 31, 43, 47\nuse the drop - down menus to explain the interquartile range of the data.\nclick the arrows to choose an answer from each menu.\nthe interquartile range helps tell the choose... of the data around the choose... . the interquartile range, which is choose... feet, represents choose... of the heights of the trees.
Answer
Explanation:
Step1: Arrange data in order
The data is already in ascending - order: 8, 11, 14, 16, 17, 21, 21, 24, 27, 31, 43, 47.
Step2: Find the median (Q2)
Since there are 12 data points, the median is the average of the 6th and 7th values. So, $Q2=\frac{21 + 21}{2}=21$.
Step3: Find Q1
The lower half of the data is 8, 11, 14, 16, 17, 21. The median of this lower - half (Q1) is the average of the 3rd and 4th values. So, $Q1=\frac{14+16}{2}=15$.
Step4: Find Q3
The upper half of the data is 21, 24, 27, 31, 43, 47. The median of this upper - half (Q3) is the average of the 3rd and 4th values. So, $Q3=\frac{27 + 31}{2}=29$.
Step5: Calculate the inter - quartile range (IQR)
$IQR=Q3 - Q1=29 - 15 = 14$.
The inter - quartile range helps tell the spread of the data around the median. The inter - quartile range, which is 14 feet, represents the middle 50% of the heights of the trees.
Answer:
The interquartile range helps tell the spread of the data around the median. The interquartile range, which is 14 feet, represents the middle 50% of the heights of the trees.