heres a box plot that summarizes juans number of rebounds in the basketball games he played this season…
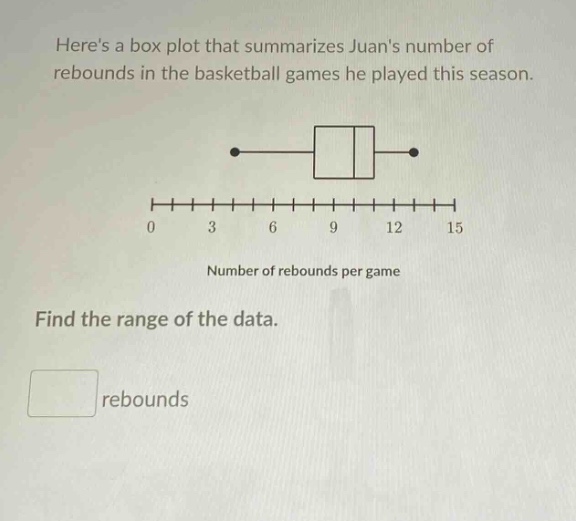
heres a box plot that summarizes juans number of rebounds in the basketball games he played this season. find the range of the data. rebounds
Answer
Explanation:
Step1: Identify max and min
In a box - plot, the end - points of the whiskers represent the minimum and maximum values. The minimum value is 0 and the maximum value is 15.
Step2: Calculate the range
The formula for the range of a data set is $Range = Max - Min$. So, $Range=15 - 0$.
Answer:
15