heres a box plot that summarizes the magnitude of earthquakes. find the range of the data.
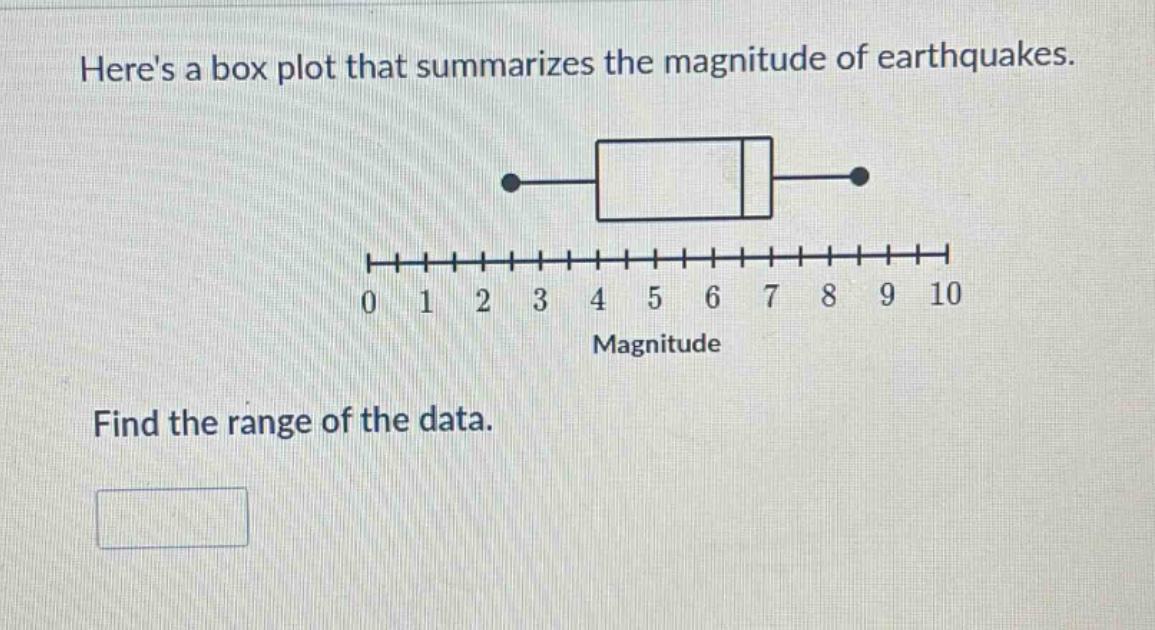
heres a box plot that summarizes the magnitude of earthquakes. find the range of the data.
Answer
Thinking...
Defining the Range
I'm focusing on finding the range of data within this box plot. It's simply the subtraction of the minimum value from the maximum value; a fundamental concept, really.
Calculating the Data Range
I've got the minimum and maximum values identified on the box plot now. The minimum is 2.5 and the maximum is 8.5. Simple subtraction will give me the range. I'm ready to find the answer.
Explanation:
Step1: Identify the minimum value.
The minimum value is the leftmost point of the whisker. $$ \text{Minimum value} = 2.5 $$
Step2: Identify the maximum value.
The maximum value is the rightmost point of the whisker. $$ \text{Maximum value} = 8.5 $$
Step3: Calculate the range.
The range is the difference between the maximum and minimum values. $$ \text{Range} = \text{Maximum value} - \text{Minimum value} $$ $$ \text{Range} = 8.5 - 2.5 $$ $$ \text{Range} = 6 $$
Answer:
6