heres a box plot that summarizes the masses of fayes pumpkins. find the range of the data. kg
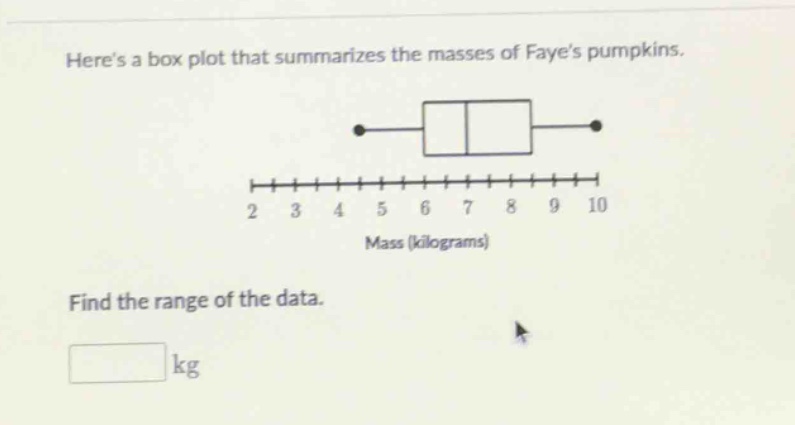
heres a box plot that summarizes the masses of fayes pumpkins. find the range of the data. kg
Answer
Explanation:
Step1: Identify the maximum value from the box plot.
The maximum value is indicated by the end of the right whisker. $$ \text{Maximum value} = 9.5 \text{ kg} $$
Step2: Identify the minimum value from the box plot.
The minimum value is indicated by the end of the left whisker. $$ \text{Minimum value} = 4.5 \text{ kg} $$
Step3: Calculate the range.
The range is the difference between the maximum and minimum values. $$ \text{Range} = \text{Maximum value} - \text{Minimum value} $$
Step4: Substitute the values and compute the range.
$$ \text{Range} = 9.5 - 4.5 = 5 \text{ kg} $$
Answer:
$5$ kg