for his science project, bill studied the frogs that live in a pond near his house. he recorded the weights…
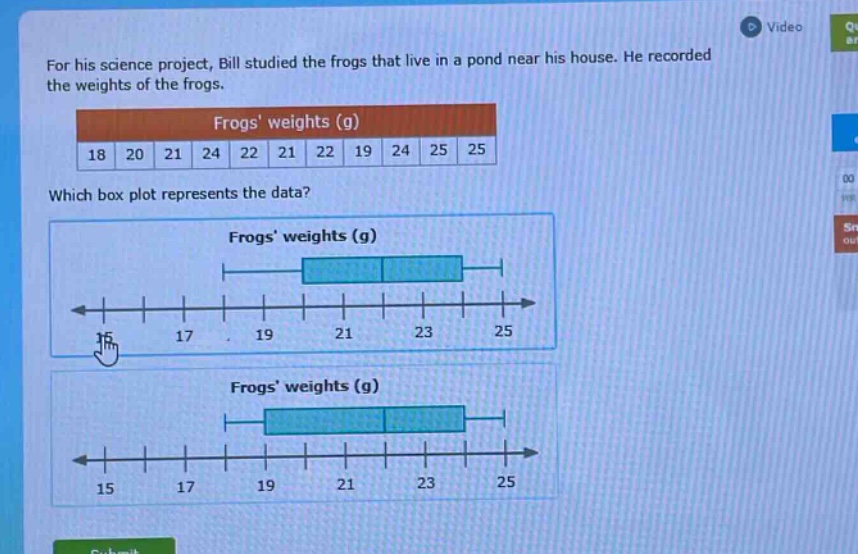
for his science project, bill studied the frogs that live in a pond near his house. he recorded the weights of the frogs.\nfrogs weights (g)\n18 20 21 24 22 21 22 19 24 25 25\nwhich box plot represents the data?\nfrogs weights (g)\nfrogs weights (g)
Answer
Explanation:
Step1: Arrange data in ascending order
18, 19, 20, 21, 21, 22, 22, 24, 24, 25, 25
Step2: Find the minimum value
The minimum value is 18.
Step3: Find the first - quartile ($Q_1$)
There are 11 data points. The position of $Q_1$ is $\frac{11 + 1}{4}=3$. So $Q_1 = 20$.
Step4: Find the median ($Q_2$)
The position of the median is $\frac{11+1}{2} = 6$. So $Q_2=22$.
Step5: Find the third - quartile ($Q_3$)
The position of $Q_3$ is $\frac{3(11 + 1)}{4}=9$. So $Q_3 = 24$.
Step6: Find the maximum value
The maximum value is 25.
Answer:
The box - plot with minimum value at 18, $Q_1$ at 20, median at 22, $Q_3$ at 24 and maximum value at 25 is the correct one. Without seeing the full options clearly, based on the calculated values, the box - plot that has the left - most whisker starting at 18, the left side of the box at 20, the line inside the box at 22, the right side of the box at 24 and the right - most whisker ending at 25 is the answer.