which histogram represents the data? 8, 9, 10, 11, 11, 14, 18, 28, 28, 29, 40, 41, 41, 44, 45, 47, 55
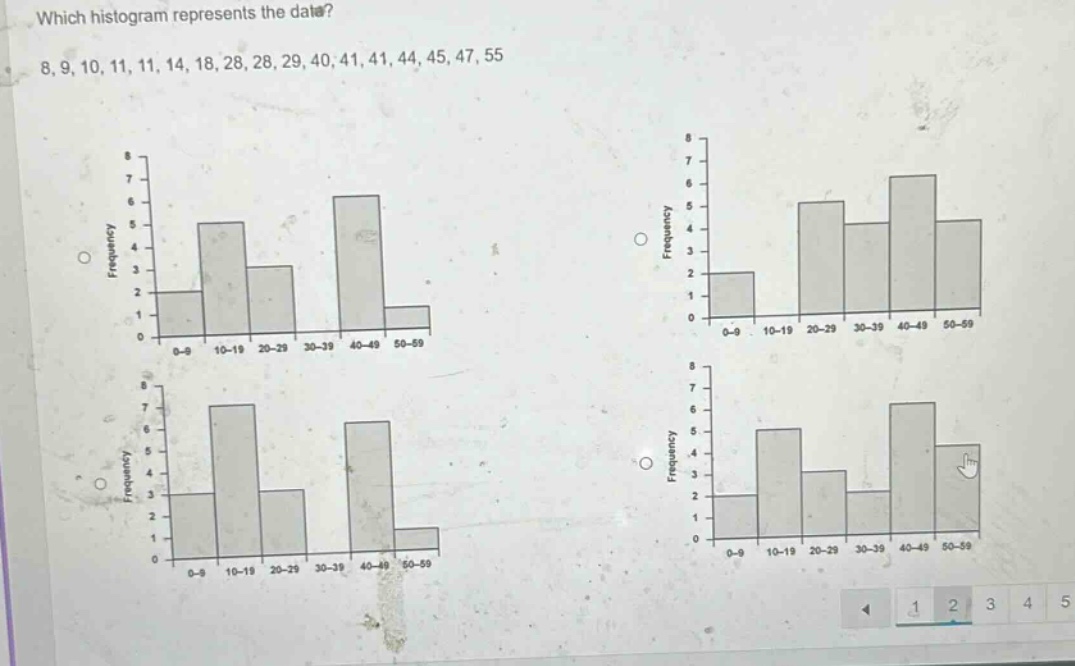
which histogram represents the data? 8, 9, 10, 11, 11, 14, 18, 28, 28, 29, 40, 41, 41, 44, 45, 47, 55
Answer
Answer:
We need to count the frequency of data in each interval:
- For the interval 0 - 9: The data 8, 9 are in this interval, so the frequency is 2.
- For the interval 10 - 19: The data 10, 11, 11, 14 are in this interval, so the frequency is 4.
- For the interval 20 - 29: The data 28, 28, 29 are in this interval, so the frequency is 3.
- For the interval 30 - 39: There is no data in this interval, so the frequency is 0.
- For the interval 40 - 49: The data 40, 41, 41, 44, 45, 47 are in this interval, so the frequency is 6.
- For the interval 50 - 59: The data 55 is in this interval, so the frequency is 1.
The histogram with frequencies 2, 4, 3, 0, 6, 1 for the intervals 0 - 9, 10 - 19, 20 - 29, 30 - 39, 40 - 49, 50 - 59 respectively is the correct one.
Explanation:
Step1: Count 0 - 9 frequency
There are 2 values (8, 9) in 0 - 9.
Step2: Count 10 - 19 frequency
There are 4 values (10, 11, 11, 14) in 10 - 19.
Step3: Count 20 - 29 frequency
There are 3 values (28, 28, 29) in 20 - 29.
Step4: Count 30 - 39 frequency
There are 0 values in 30 - 39.
Step5: Count 40 - 49 frequency
There are 6 values (40, 41, 41, 44, 45, 47) in 40 - 49.
Step6: Count 50 - 59 frequency
There is 1 value (55) in 50 - 59.