the histogram represents the distributions of boiling temperatures, in degrees celsius, of tap water and a…
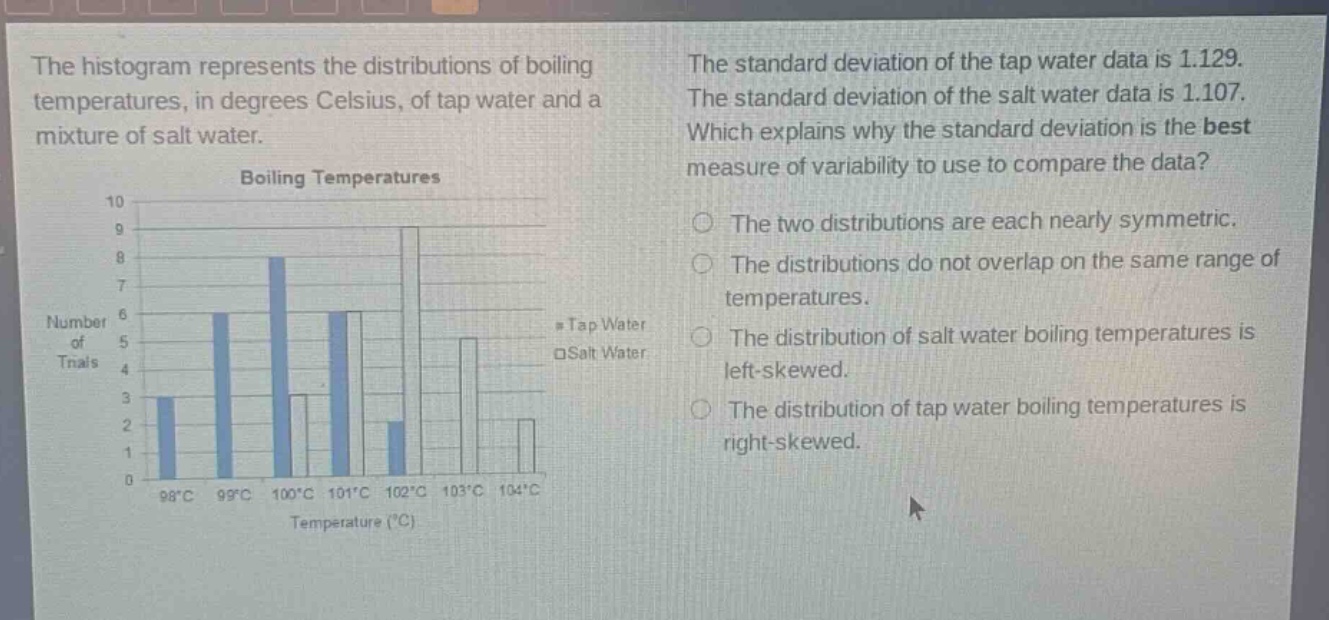
the histogram represents the distributions of boiling temperatures, in degrees celsius, of tap water and a mixture of salt water. the standard deviation of the tap water data is 1.129. the standard deviation of the salt water data is 1.107. which explains why the standard deviation is the best measure of variability to use to compare the data? boiling temperatures 10 9 8 7 6 5 4 3 2 1 0 98°c 99°c 100°c 101°c 102°c 103°c 104°c temperature (°c) number of trials tap water salt water the two distributions are each nearly symmetric. the distributions do not overlap on the same range of temperatures. the distribution of salt water boiling temperatures is left - skewed. the distribution of tap water boiling temperatures is right - skewed.
Answer
Answer:
The two distributions are each nearly symmetric.
Brief Explanations:
Standard - deviation is a good measure for symmetric distributions as it measures the spread around the mean. When distributions are symmetric, mean is a good central - tendency measure and standard - deviation effectively shows variability around it.