the histogram represents the distributions of essay scores for high school sophomores and juniors in a…
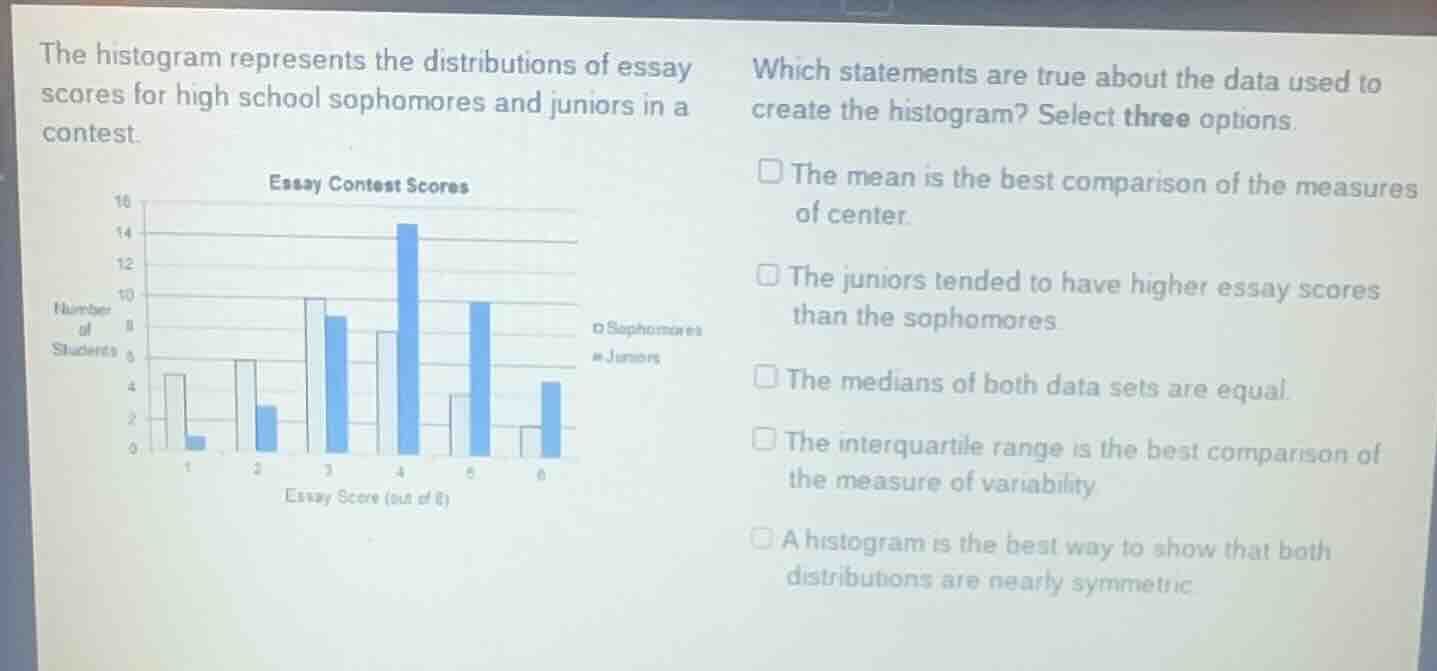
the histogram represents the distributions of essay scores for high school sophomores and juniors in a contest.\n\nwhich statements are true about the data used to create the histogram? select three options.\n\n- the mean is the best comparison of the measures of center.\n- the juniors tended to have higher essay scores than the sophomores.\n- the medians of both data sets are equal.\n- the interquartile range is the best comparison of the measure of variability.\n- a histogram is the best way to show that both distributions are nearly symmetric.
Answer
Explanation:
Step1: Analyze the symmetry of the distributions
The Sophomores' distribution is roughly bell-shaped and symmetric around score 3. The Juniors' distribution is roughly bell-shaped and symmetric around score 4.
Step2: Determine the best measure of center
For nearly symmetric distributions, the mean is a reliable and standard measure of center for comparison.
Step3: Compare the performance of both groups
The Juniors' distribution is shifted to the right compared to the Sophomores, with a peak at 4 versus 3, indicating higher scores on average.
Step4: Evaluate the suitability of the histogram
The histogram clearly displays the frequency of scores for both groups, allowing for a visual assessment of their nearly symmetric shapes.
Answer:
- The mean is the best comparison of the measures of center.
- The juniors tended to have higher essay scores than the sophomores.
- A histogram is the best way to show that both distributions are nearly symmetric.