which histogram represents a set of data that is left - skewed?
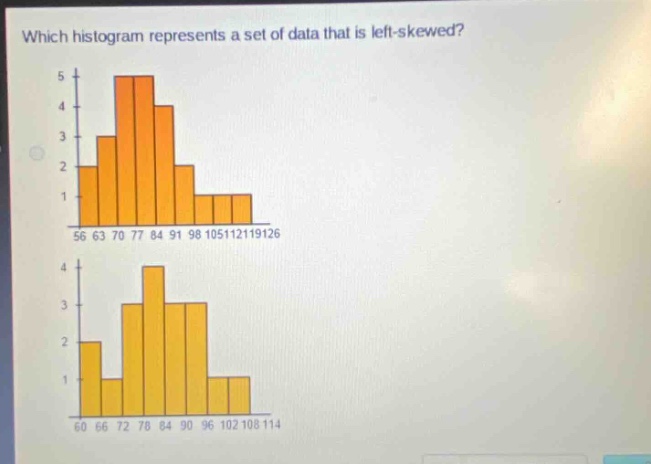
which histogram represents a set of data that is left - skewed?
Answer
Brief Explanations:
In a left - skewed distribution, the tail of the distribution extends to the left. This means that there are a few relatively small values that pull the tail in the left direction. Looking at the histograms, the one where the bars have a long tail of lower - frequency bars on the left side represents a left - skewed distribution.
Answer:
The histogram with the longer tail of bars on the left side (the first histogram in the image where the bars gradually decrease in height towards the left side) represents a left - skewed set of data.