each histogram represents a set of data with a median of 29.5. which set of data most likely has a mean that…
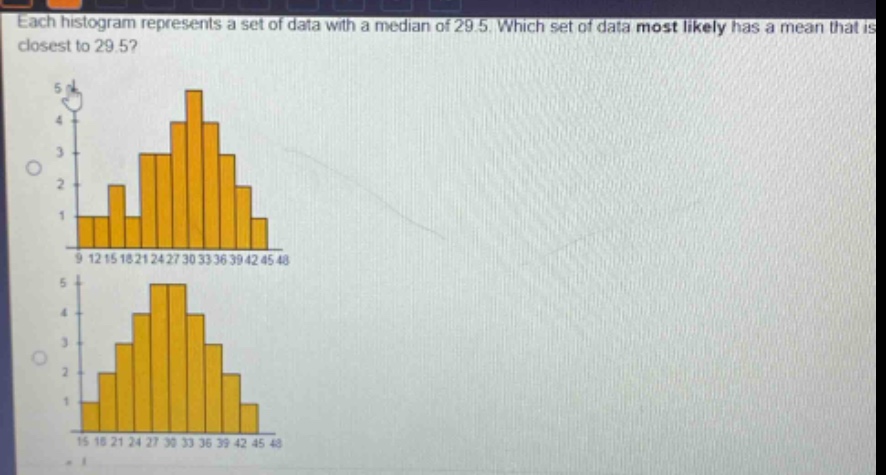
each histogram represents a set of data with a median of 29.5. which set of data most likely has a mean that is closest to 29.5?
Answer
Explanation:
Step1: Recall mean - median relationship
In a symmetric distribution, the mean and median are approximately equal. In a skewed - right distribution, the mean is greater than the median, and in a skewed - left distribution, the mean is less than the median.
Step2: Analyze the histograms
The first histogram is skewed to the right (the tail is on the right - hand side), so the mean will be greater than the median. The second histogram is more symmetric. Since in a symmetric distribution the mean is closest to the median, the second histogram's data set is most likely to have a mean closest to the median.
Answer:
The second histogram's data set.