the histogram shows a citys daily high temperatures recorded for four weeks. which phrase describes the…
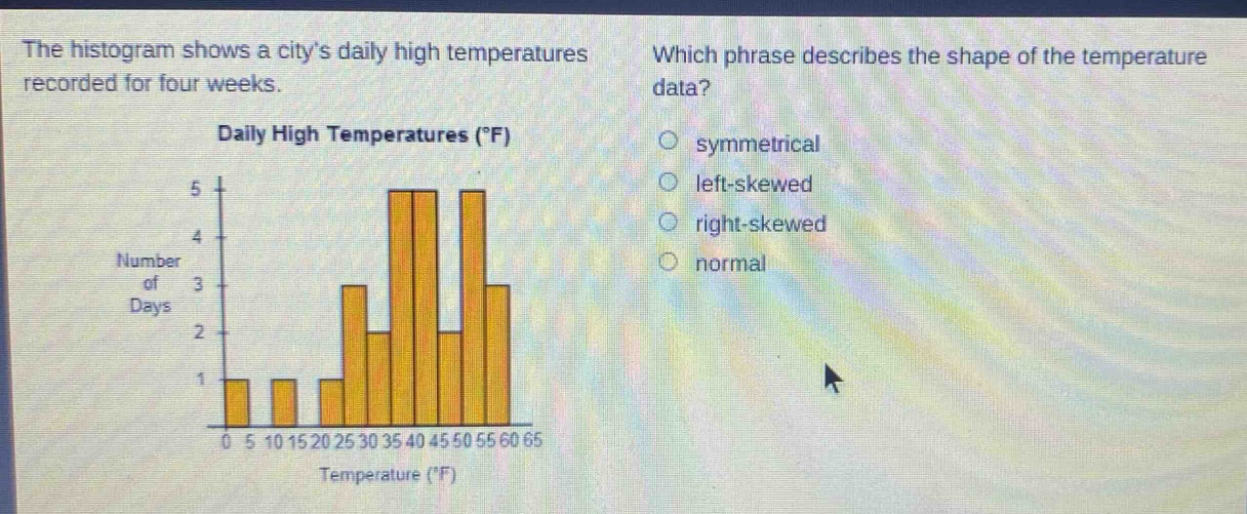
the histogram shows a citys daily high temperatures recorded for four weeks. which phrase describes the shape of the temperature data? daily high temperatures (°f) number of days temperature (°f) symmetrical left - skewed right - skewed normal
Answer
Answer:
symmetrical
Explanation:
Step1: Observe the histogram
The bars on either side of the center (around 40 - 45°F) are approximately mirror - images.
Step2: Recall shape definitions
In a symmetrical distribution, the left and right sides are similar in shape. Here, the histogram has this property.