the histogram shows a citys daily high temperatures recorded for four weeks. which phrase describes the…
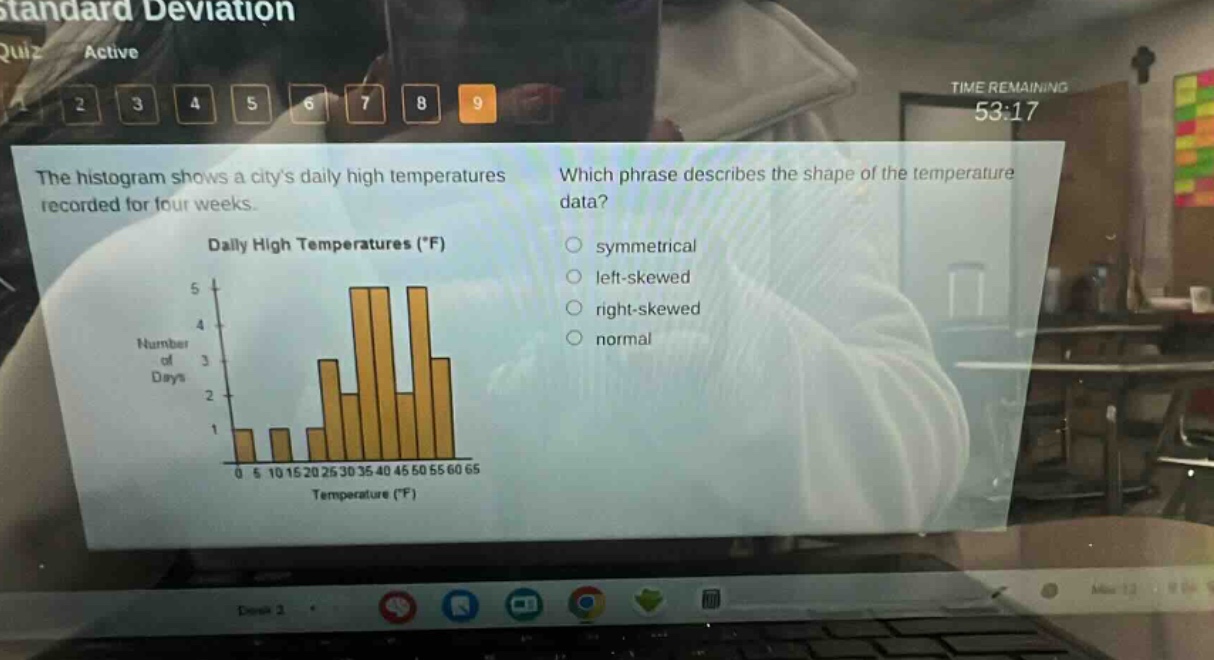
the histogram shows a citys daily high temperatures recorded for four weeks. which phrase describes the shape of the temperature data? symmetrical left - skewed right - skewed normal daily high temperatures (°f) 0 5 10 15 20 25 30 35 40 45 50 55 60 65 temperature (°f) 1 2 3 4 5 number of days
Answer
Brief Explanations:
In a left - skewed distribution, the tail of the distribution extends to the left. Looking at the histogram, the tail of the data (the part with fewer data points) extends to the left. The peak of the data is on the right - hand side.
Answer:
left - skewed