the histogram shows the distribution of stops for red traffic lights a commuter must pass through on her way…
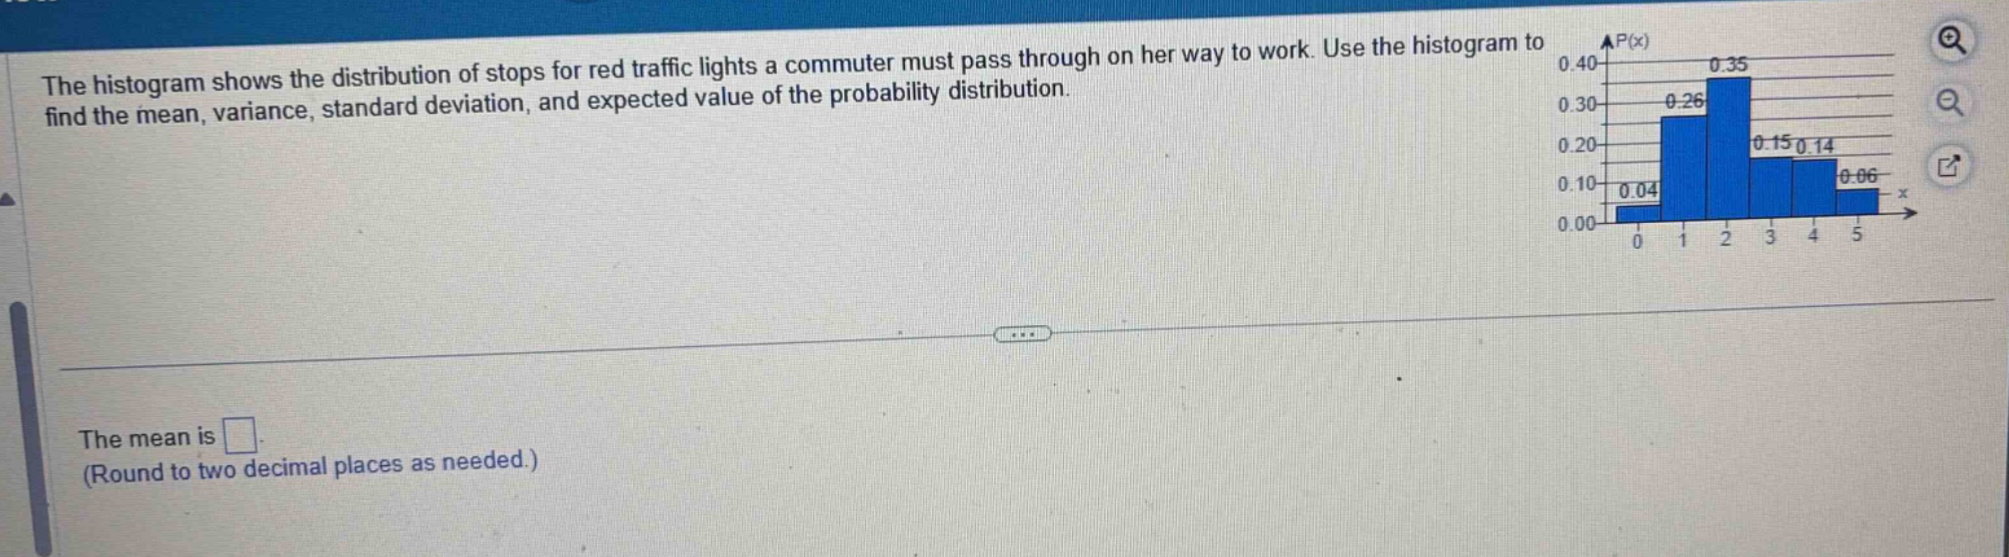
the histogram shows the distribution of stops for red traffic lights a commuter must pass through on her way to work. use the histogram to find the mean, variance, standard deviation, and expected value of the probability distribution.\nthe mean is \n(round to two decimal places as needed.)
Answer
Answer:
$2.19$
Explanation:
Step1: Recall mean formula
$\mu=\sum_{x}x\cdot P(x)$
Step2: Calculate product for each $x$ - $P(x)$ pair
For $x = 0$, $0\times0.04 = 0$; for $x = 1$, $1\times0.26=0.26$; for $x = 2$, $2\times0.35 = 0.7$; for $x = 3$, $3\times0.15=0.45$; for $x = 4$, $4\times0.14 = 0.56$; for $x = 5$, $5\times0.06=0.3$.
Step3: Sum up the products
$\mu=0 + 0.26+0.7+0.45+0.56+0.3=2.19$