the histogram shows the distributions of essay scores for high school sophomores and juniors in a contest…
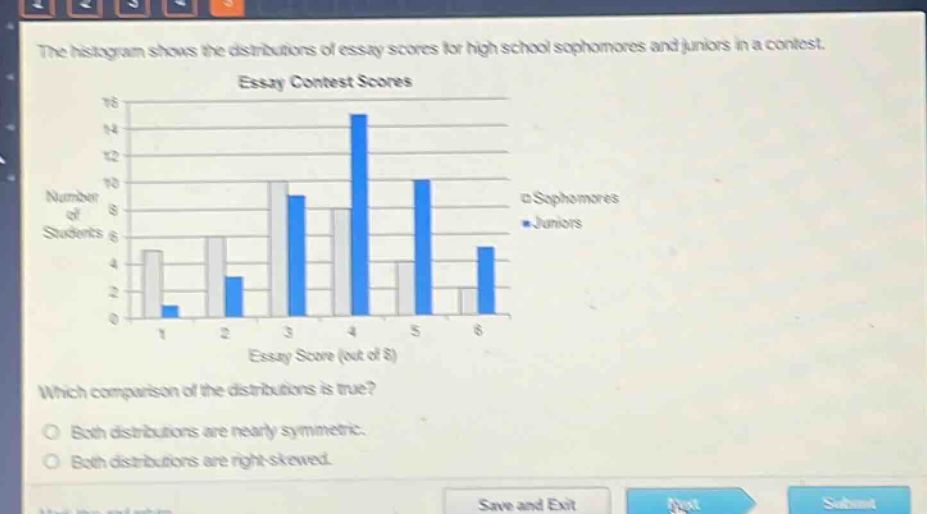
the histogram shows the distributions of essay scores for high school sophomores and juniors in a contest. essay contest scores. which comparison of the distributions is true? both distributions are nearly symmetric. both distributions are right - skewed.
Answer
Explanation:
Step1: Analyze the shape of sophomore distribution
The sophomore distribution has a higher frequency on the left - side (scores 1 - 3) and tapers off towards the right (scores 4 - 6), which is right - skewed.
Step2: Analyze the shape of junior distribution
The junior distribution has a higher frequency on the left - side (scores 1 - 3) and tapers off towards the right (scores 4 - 6), which is right - skewed.
Answer:
Both distributions are right - skewed.