the histogram shows the duration, in minutes, of movies in theaters. what relationship between the median…
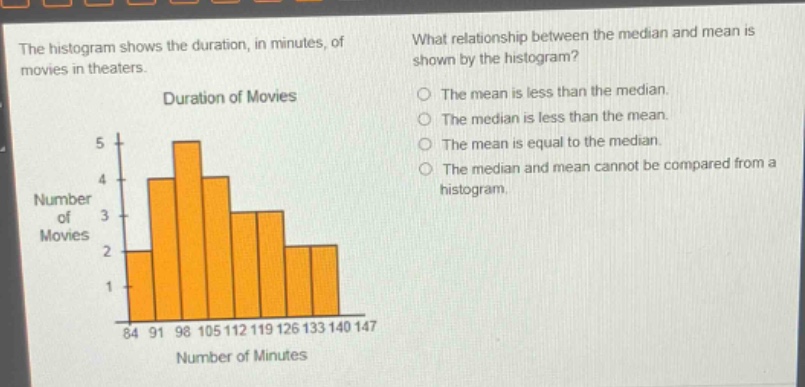
the histogram shows the duration, in minutes, of movies in theaters. what relationship between the median and mean is shown by the histogram? duration of movies the mean is less than the median. the median is less than the mean. the mean is equal to the median. the median and mean cannot be compared from a histogram. 5 4 number of movies 3 2 1 84 91 98 105 112 119 126 133 140 147 number of minutes
Answer
Explanation:
Step1: Analyze histogram shape
The histogram is skewed right. In a right - skewed distribution, the tail on the right side (higher values) pulls the mean in that direction.
Step2: Recall mean - median relationship
For a right - skewed distribution, the mean is greater than the median because the extreme high values in the tail affect the mean more than the median.
Answer:
The median is less than the mean.