the histogram shows the number of morning customers who visited north cafe and south cafe over a one - month…
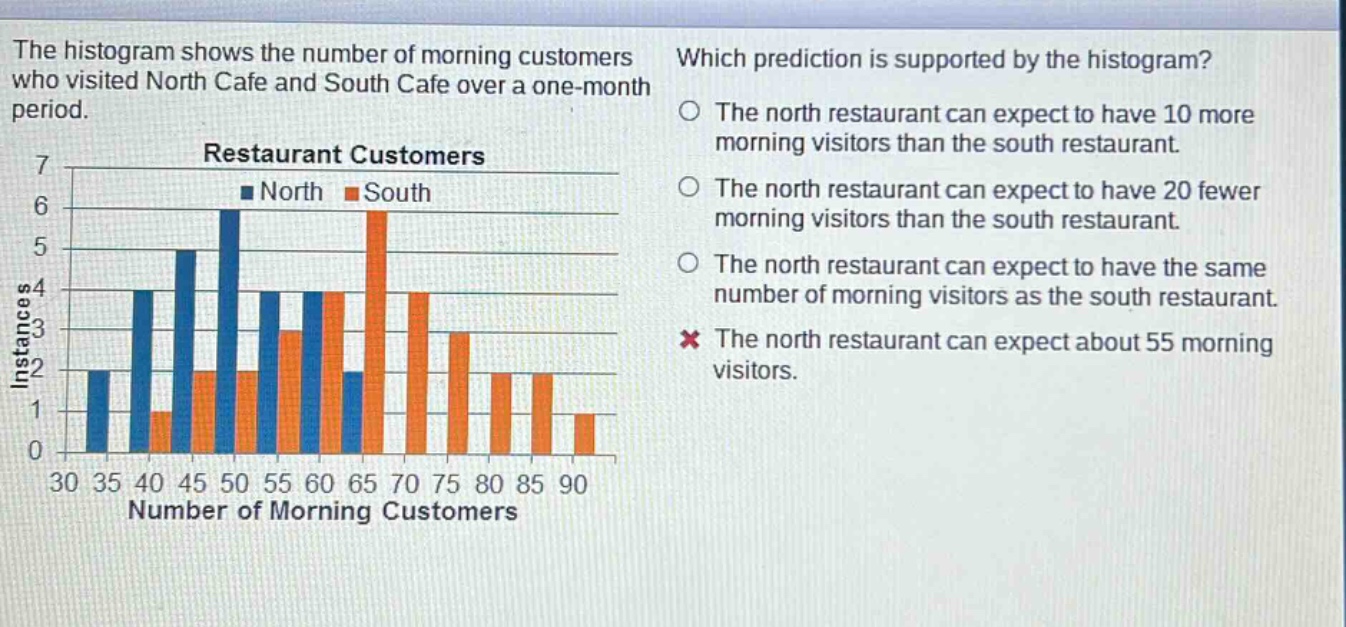
the histogram shows the number of morning customers who visited north cafe and south cafe over a one - month period. which prediction is supported by the histogram? the north restaurant can expect to have 10 more morning visitors than the south restaurant. the north restaurant can expect to have 20 fewer morning visitors than the south restaurant. the north restaurant can expect to have the same number of morning visitors as the south restaurant. the north restaurant can expect about 55 morning visitors.
Answer
Explanation:
Step1: Calculate the total number of instances (days) for North Cafe.
Sum the heights of the blue bars: $$ \text{Total Days (North)} = 2 + 4 + 5 + 6 + 4 + 4 + 2 = 27 $$
Step2: Calculate the estimated total number of customers for North Cafe.
Multiply the midpoint of each bin by its frequency (instances) and sum the results. $$ \text{Total Customers (North)} \approx (32.5 \times 2) + (42.5 \times 4) + (47.5 \times 5) + (52.5 \times 6) + (57.5 \times 4) + (62.5 \times 4) + (67.5 \times 2) $$ $$ \text{Total Customers (North)} \approx 65 + 170 + 237.5 + 315 + 230 + 250 + 135 = 1402.5 $$
Step3: Calculate the average daily customers for North Cafe.
Divide the total estimated customers by the total number of days. $$ \text{Average (North)} = \frac{1402.5}{27} \approx 51.94 $$
Step4: Calculate the total number of instances (days) for South Cafe.
Sum the heights of the orange bars: $$ \text{Total Days (South)} = 1 + 1 + 2 + 2 + 3 + 4 + 6 + 4 + 3 + 2 + 2 + 1 = 31 $$
Step5: Calculate the estimated total number of customers for South Cafe.
Multiply the midpoint of each bin by its frequency (instances) and sum the results. $$ \text{Total Customers (South)} \approx (37.5 \times 1) + (42.5 \times 1) + (47.5 \times 2) + (52.5 \times 2) + (57.5 \times 3) + (62.5 \times 4) + (67.5 \times 6) + (72.5 \times 4) + (77.5 \times 3) + (82.5 \times 2) + (87.5 \times 2) + (92.5 \times 1) $$ $$ \text{Total Customers (South)} \approx 37.5 + 42.5 + 95 + 105 + 172.5 + 250 + 405 + 290 + 232.5 + 165 + 175 + 92.5 = 2062.5 $$
Step6: Calculate the average daily customers for South Cafe.
Divide the total estimated customers by the total number of days. $$ \text{Average (South)} = \frac{2062.5}{31} \approx 66.53 $$
Step7: Evaluate the predictions.
Compare the calculated averages with the given options. Option 1: North ($ \approx 52 $) does not have 10 more than South ($ \approx 67 $). Option 2: North ($ \approx 52 $) has about $ 67 - 52 = 15 $ fewer visitors than South, not 20 fewer. Option 3: North ($ \approx 52 $) and South ($ \approx 67 $) do not have the same number of visitors. Option 4: North's average ($ \approx 52 $) is reasonably close to 55.
Answer:
The north restaurant can expect about 55 morning visitors.