the histogram below shows the number of points scored by a high school basketball team over two seasons. one…
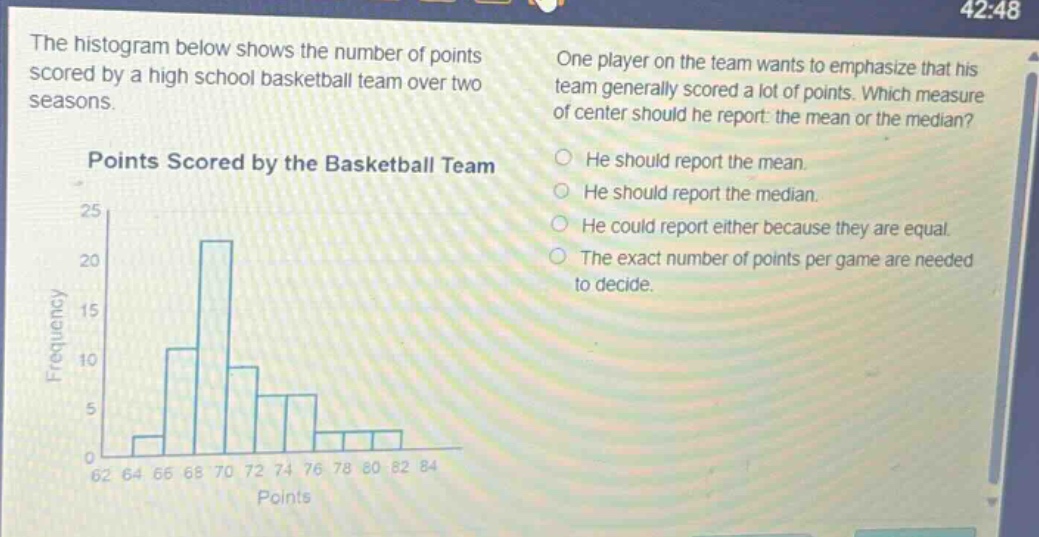
the histogram below shows the number of points scored by a high school basketball team over two seasons. one player on the team wants to emphasize that his team generally scored a lot of points. which measure of center should he report: the mean or the median? points scored by the basketball team he should report the mean. he should report the median. he could report either because they are equal. the exact number of points per game are needed to decide.
Answer
Explanation:
Step1: Understand mean and median
The mean is affected by extreme - values. The median is the middle - value and is not affected by extreme values.
Step2: Analyze the distribution
The histogram is right - skewed (tail on the right). In a right - skewed distribution, the mean is pulled towards the tail (higher values) and is greater than the median.
Step3: Choose the measure
To emphasize that the team generally scored a lot of points, the player should report the mean since it is higher than the median in a right - skewed distribution.
Answer:
He should report the mean.