the histogram shows the results of a survey asking students how many windows are in their homes. how many…
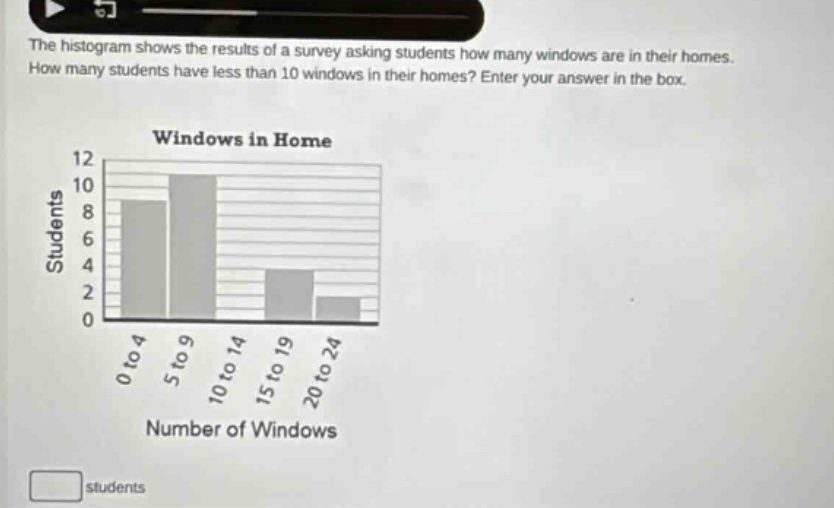
the histogram shows the results of a survey asking students how many windows are in their homes. how many students have less than 10 windows in their homes? enter your answer in the box. windows in home students 12 10 8 6 4 2 0 0 to 4 5 to 9 10 to 14 15 to 19 20 to 24 number of windows students
Answer
Explanation:
Step1: Identify relevant intervals
We need to consider the intervals 0 - 4 and 5 - 9 as they represent less than 10 windows.
Step2: Read the frequencies
From the histogram, the frequency for 0 - 4 windows is 8 and for 5 - 9 windows is 10.
Step3: Calculate total
Add the frequencies: $8 + 10=18$.
Answer:
18