the histogram below shows student test scores. how many students are represented in this histogram? number…
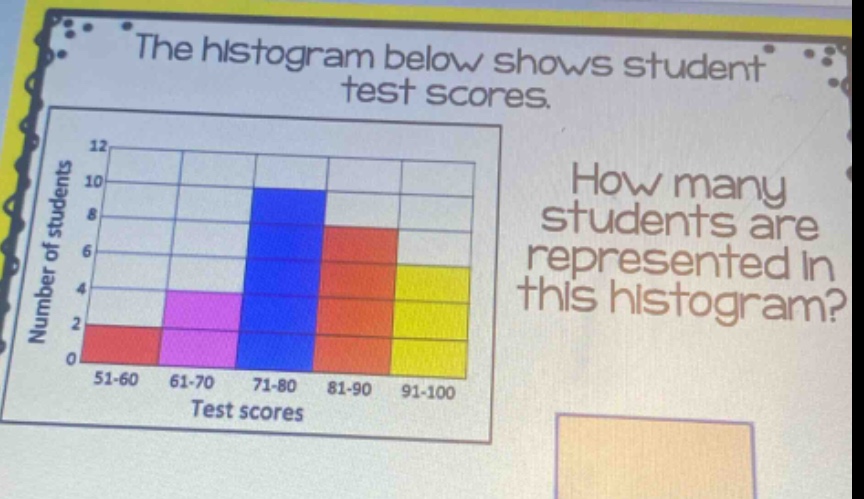
the histogram below shows student test scores. how many students are represented in this histogram? number of students 12 10 8 6 4 2 0 51 - 60 61 - 70 71 - 80 81 - 90 91 - 100 test scores
Answer
Explanation:
Step1: Identify frequencies
From the histogram, the frequencies for score - ranges are: 2 for 51 - 60, 4 for 61 - 70, 10 for 71 - 80, 8 for 81 - 90, 5 for 91 - 100.
Step2: Sum the frequencies
$2 + 4+10 + 8+5$ $= 29$
Answer:
29