the histogram shows the weights, in pounds, of checked luggage on a flight. the median weight of a checked…
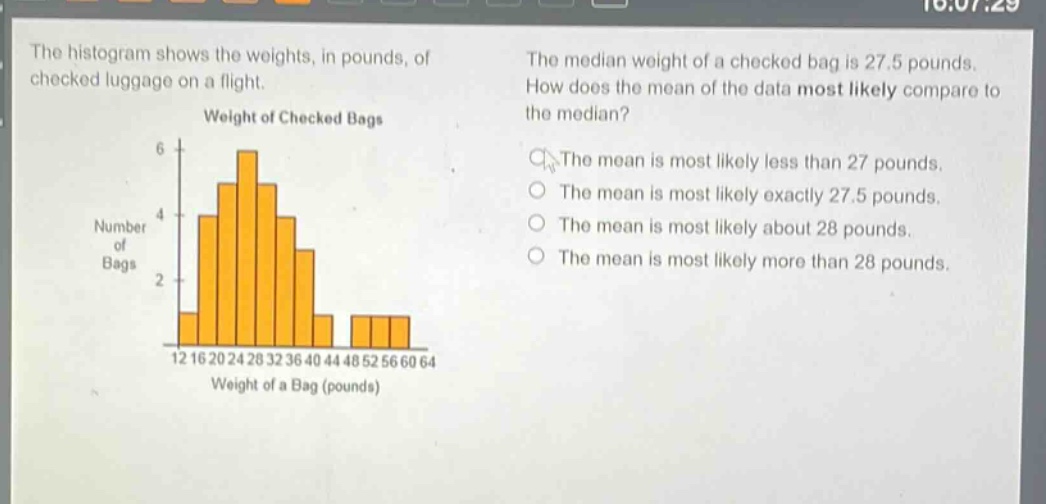
the histogram shows the weights, in pounds, of checked luggage on a flight. the median weight of a checked bag is 27.5 pounds. how does the mean of the data most likely compare to the median? the mean is most likely less than 27 pounds. the mean is most likely exactly 27.5 pounds. the mean is most likely about 28 pounds. the mean is most likely more than 28 pounds.
Answer
Explanation:
Step1: Analyze histogram shape
The histogram is right - skewed as there are a few larger values (the tail on the right side).
Step2: Recall mean - median relationship in skewed data
In a right - skewed distribution, the mean is pulled in the direction of the tail (the larger values), so the mean is greater than the median.
Step3: Compare with given median
The median is 27.5 pounds. Since the mean is greater than the median in a right - skewed distribution, and looking at the options, the mean is most likely more than 28 pounds.
Answer:
The mean is most likely more than 28 pounds.