the histograms below show the ages of dogs at four different shelters. for which set of data is the mean…
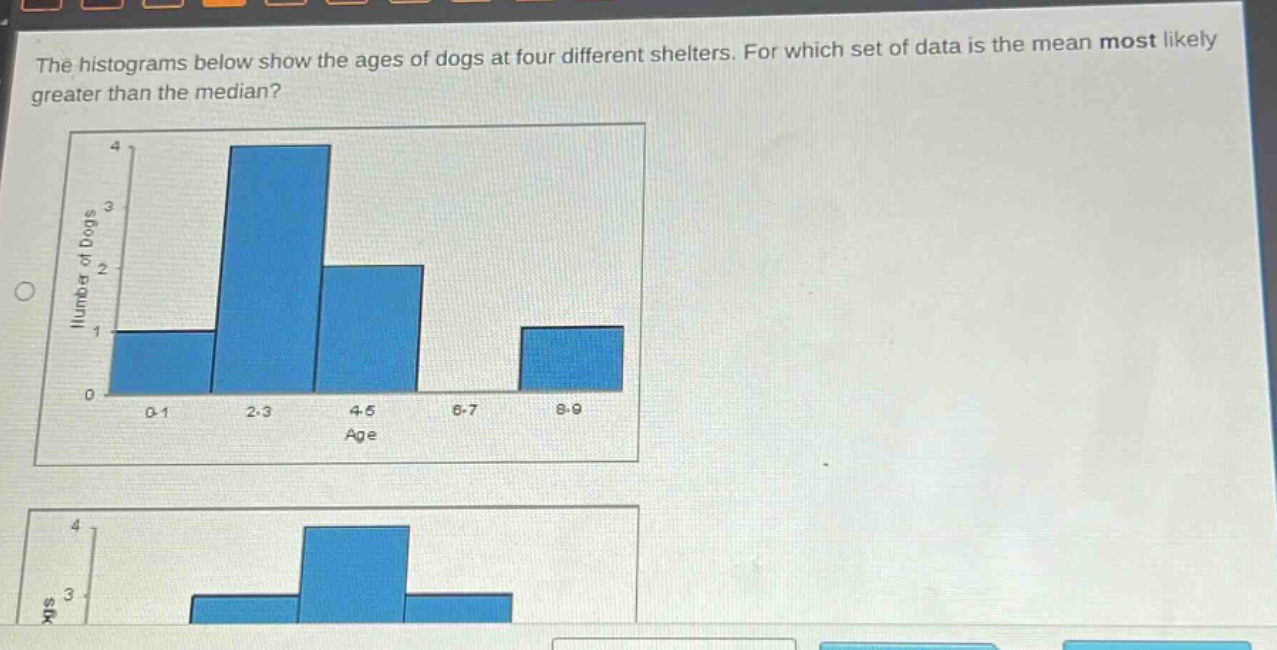
the histograms below show the ages of dogs at four different shelters. for which set of data is the mean most likely greater than the median?
Answer
Explanation:
Step1: Recall distribution - mean - median relationship
In a right - skewed distribution, the mean is greater than the median.
Step2: Analyze the histograms
We need to look for a histogram that is right - skewed (has a long tail on the right side). In the first histogram, there are a few data points in the higher age groups (8 - 9) which create a right - tail.
Answer:
The first histogram (the one with data points in the 8 - 9 age group creating a right - tail)