each hour, for several hours, the owner of a bakery recorded the number of customers who entered the store…
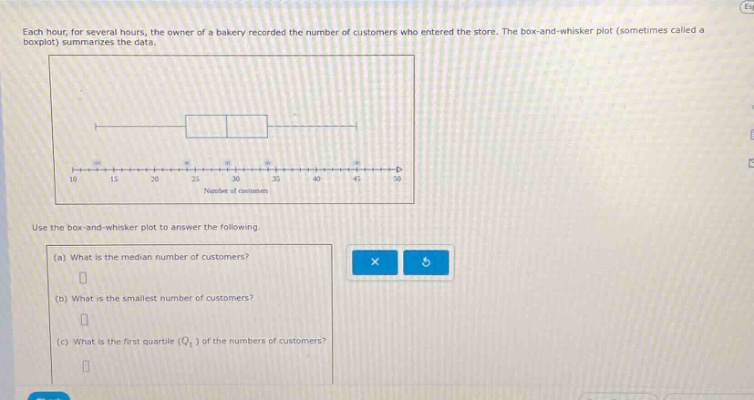
each hour, for several hours, the owner of a bakery recorded the number of customers who entered the store. the box - and - whisker plot (sometimes called a boxplot) summarizes the data. use the box - and - whisker plot to answer the following. (a) what is the median number of customers? (b) what is the smallest number of customers? (c) what is the first quartile (q1) of the numbers of customers?
Answer
Explanation:
Step1: Identify median in box - plot
The line inside the box represents the median. In the given box - and - whisker plot, the line inside the box is at 30. So the median number of customers is 30.
Step2: Identify smallest value
The end of the left - most whisker represents the smallest value. Here, the end of the left - most whisker is at 15. So the smallest number of customers is 15.
Step3: Identify first quartile
The left - hand side of the box represents the first quartile ($Q_1$). In the plot, the left - hand side of the box is at 25. So the first quartile ($Q_1$) of the numbers of customers is 25.
Answer:
(a) 30 (b) 15 (c) 25