hours of practice this week the dot plot shows the number of hours students in the band practiced their…
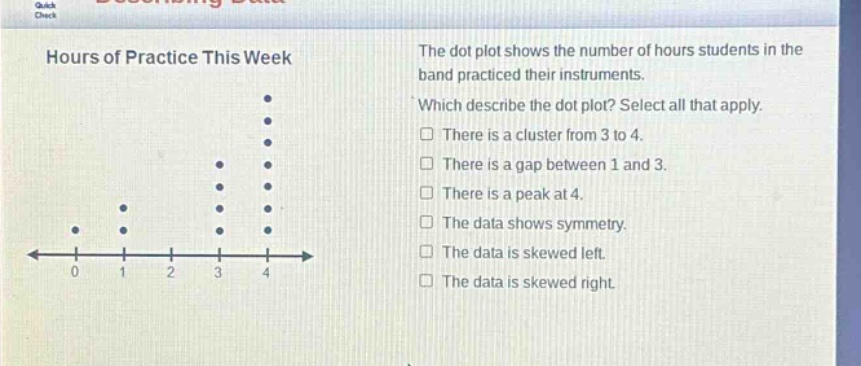
hours of practice this week the dot plot shows the number of hours students in the band practiced their instruments. which describe the dot plot? select all that apply. there is a cluster from 3 to 4. there is a gap between 1 and 3. there is a peak at 4. the data shows symmetry. the data is skewed left. the data is skewed right.
Answer
Answer:
- There is a cluster from 3 to 4.
- There is a gap between 1 and 3.
- There is a peak at 4.
Explanation:
Step1: Identify cluster
Count dots in intervals. Most dots are from 3 - 4.
Step2: Identify gap
No dots between 1 and 3.
Step3: Identify peak
Most dots are at 4.
Step4: Check symmetry
Data is not symmetric.
Step5: Check skewness
Data is not skewed left or right in a clear - cut way.