ian sells his drawings at weekend art fairs. he recorded how much he earned each weekend for the past few…
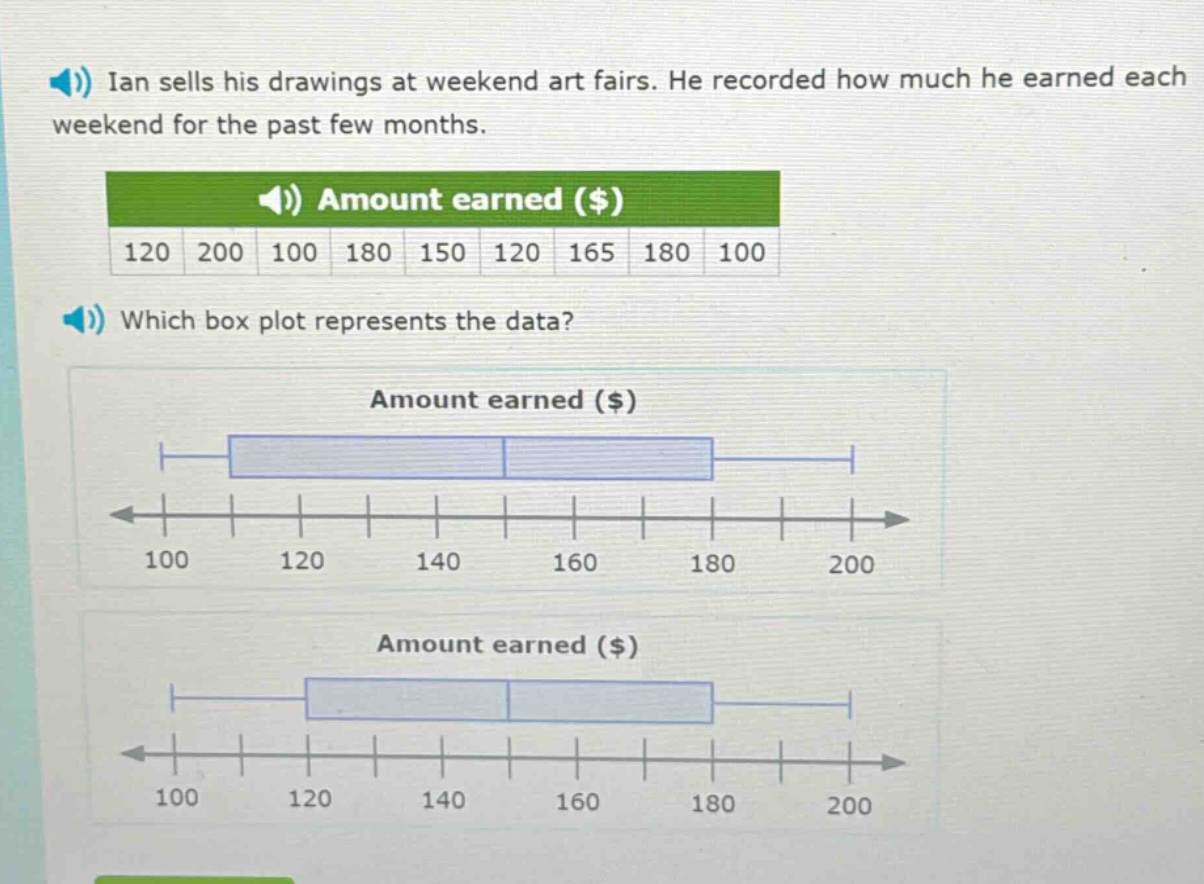
ian sells his drawings at weekend art fairs. he recorded how much he earned each weekend for the past few months.\namount earned ($)\n120 200 100 180 150 120 165 180 100\nwhich box plot represents the data?\namount earned ($)\n100 120 140 160 180 200\namount earned ($)\n100 120 140 160 180 200
Answer
Explanation:
Step1: Arrange data in ascending order
100, 100, 120, 120, 150, 165, 180, 180, 200
Step2: Find the minimum value
The minimum value is 100.
Step3: Find the first - quartile ($Q_1$)
There are 9 data points. The position of $Q_1$ is $\frac{1\times(9 + 1)}{4}=2.5$. So, $Q_1=\frac{100 + 120}{2}=110$.
Step4: Find the median ($Q_2$)
The position of the median is $\frac{9+1}{2}=5$. So, $Q_2 = 150$.
Step5: Find the third - quartile ($Q_3$)
The position of $Q_3$ is $\frac{3\times(9 + 1)}{4}=7.5$. So, $Q_3=\frac{180+180}{2}=180$.
Step6: Find the maximum value
The maximum value is 200.
The box - plot should have the left - most whisker at 100, the left side of the box at 110, the line inside the box at 150, the right side of the box at 180, and the right - most whisker at 200.
Answer:
The box - plot with the left - most whisker at 100, left side of the box at a value between 100 and 120 (around 110), line inside the box at 150, right side of the box at 180, and right - most whisker at 200. (Based on the above calculations, you need to visually pick the correct box - plot from the given options).