an ice cream shop owner noticed that ice cream cone sales have a positive association with increasing…
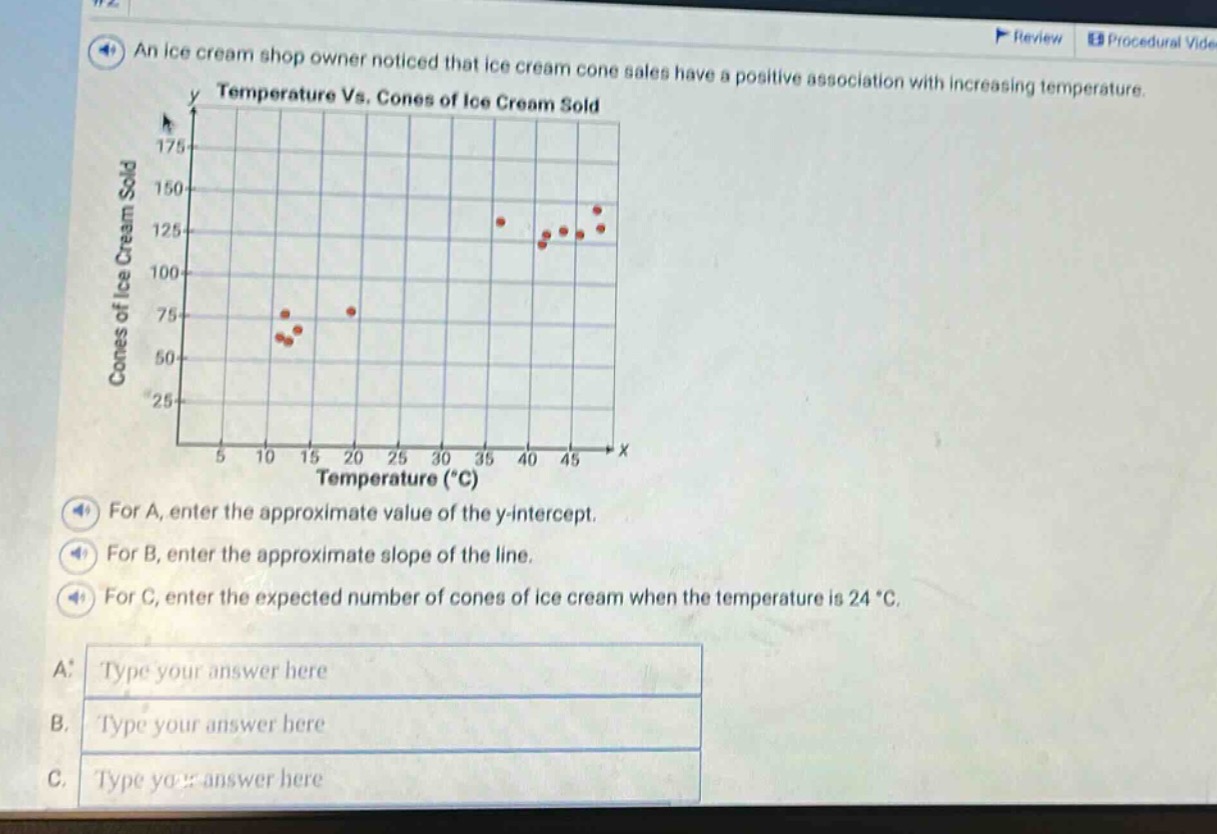
an ice cream shop owner noticed that ice cream cone sales have a positive association with increasing temperature.\ntemperature vs. cones of ice cream sold\nfor a, enter the approximate value of the y - intercept.\nfor b, enter the approximate slope of the line.\nfor c, enter the expected number of cones of ice cream when the temperature is 24 °c.
Answer
Explanation:
Step1: Estimate y - intercept
By looking at the scatter - plot, when $x = 0$ (temperature = 0°C), the value of $y$ (number of ice - cream cones sold) is approximately 25.
Step2: Estimate slope
Choose two points on the approximate line of best - fit. Let's take $(10,50)$ and $(40,125)$. The slope formula is $m=\frac{y_2 - y_1}{x_2 - x_1}$. So, $m=\frac{125 - 50}{40 - 10}=\frac{75}{30}=2.5$.
Step3: Find the equation of the line
The equation of a line is $y=mx + b$, where $m$ is the slope and $b$ is the y - intercept. We have $m = 2.5$ and $b = 25$, so the equation is $y=2.5x+25$.
Step4: Predict number of cones at 24°C
Substitute $x = 24$ into the equation $y=2.5x + 25$. Then $y=2.5\times24+25=60 + 25=85$.
Answer:
A. 25 B. 2.5 C. 85