identify any clusters, gaps, or outliers for the dot plot. sample problem there is a cluster from 2 to 8.
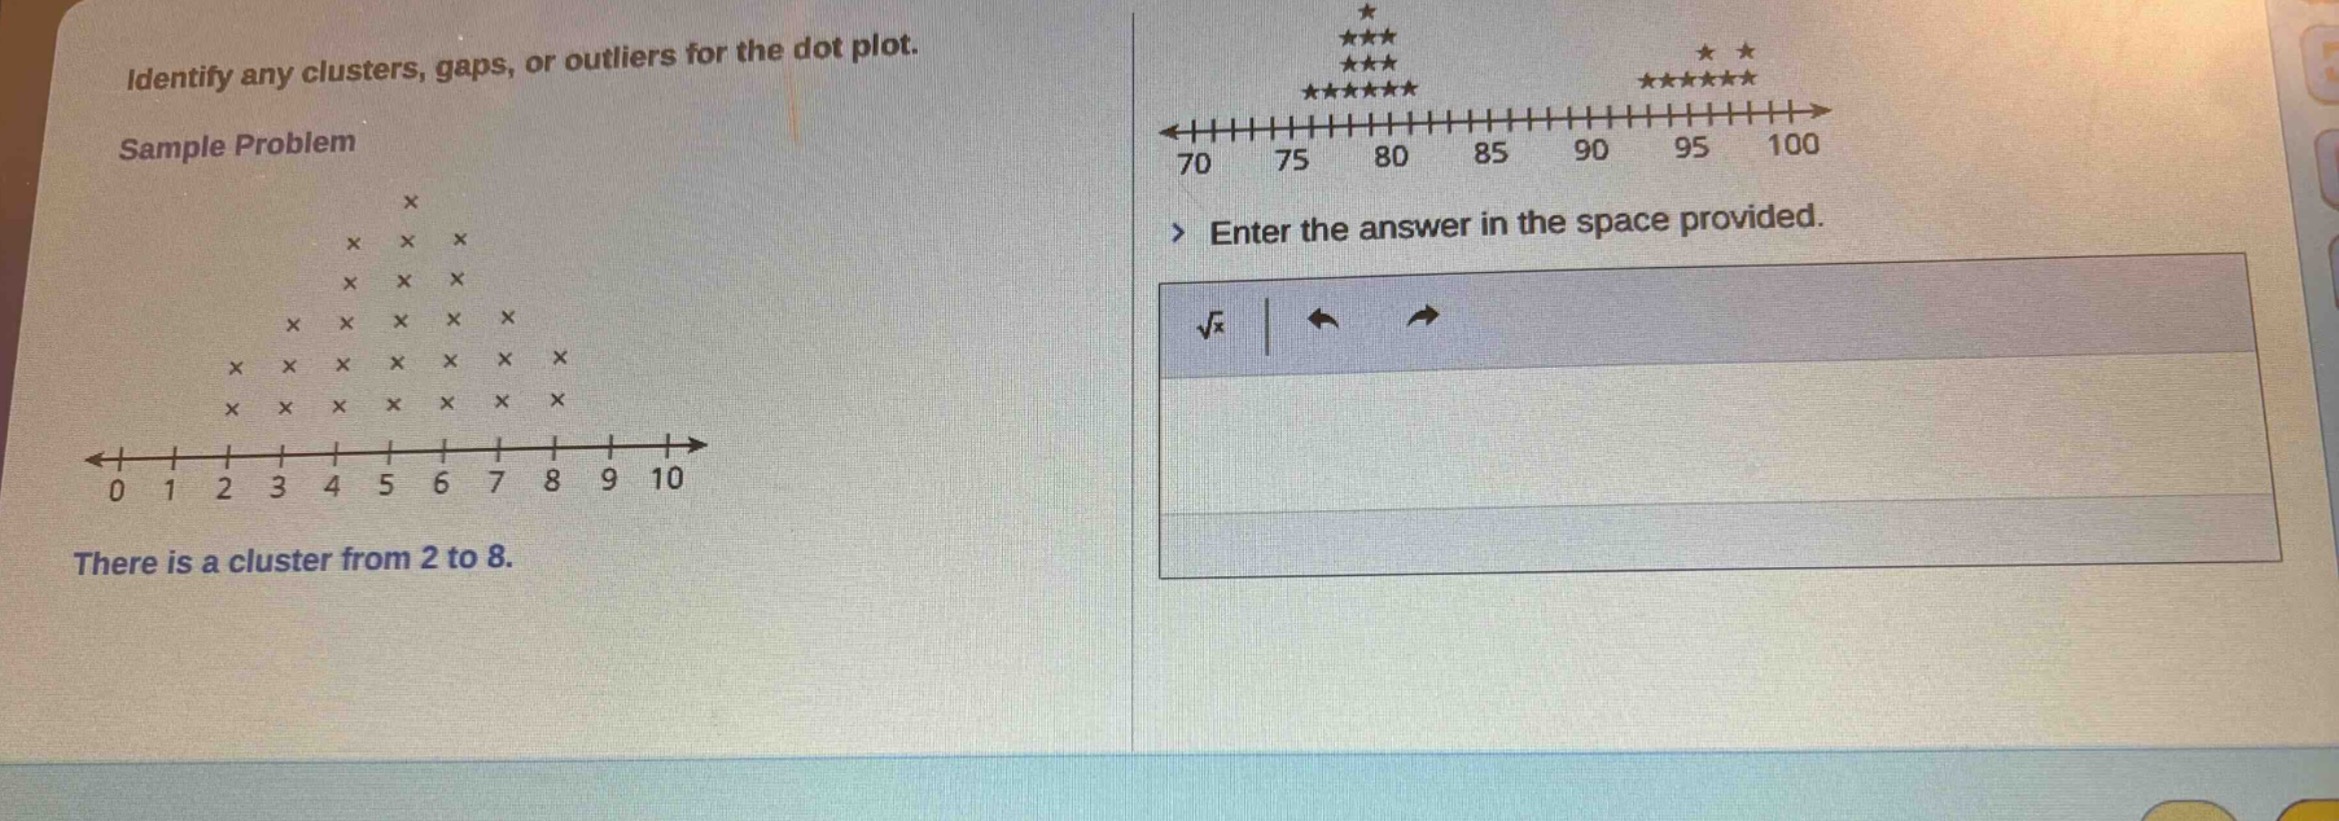
identify any clusters, gaps, or outliers for the dot plot. sample problem there is a cluster from 2 to 8.
Answer
Explanation:
Step1: Identificar clústeres
Observamos donde hay puntos concentrados. Hay un clúster de 75 a 80, ya que hay muchos puntos en ese rango. También hay un clúster de 95 a 100.
Step2: Identificar brechas
Entre 80 y 95 no hay puntos, por lo que hay una brecha en ese rango.
Step3: Identificar valores atípicos
No hay puntos aislados que se consideren valores atípicos.
Answer:
Clústeres: 75 - 80 y 95 - 100; Brecha: 80 - 95; No hay valores atípicos.