identify the level of association and correlation in the scatterplot. strong association, negative…
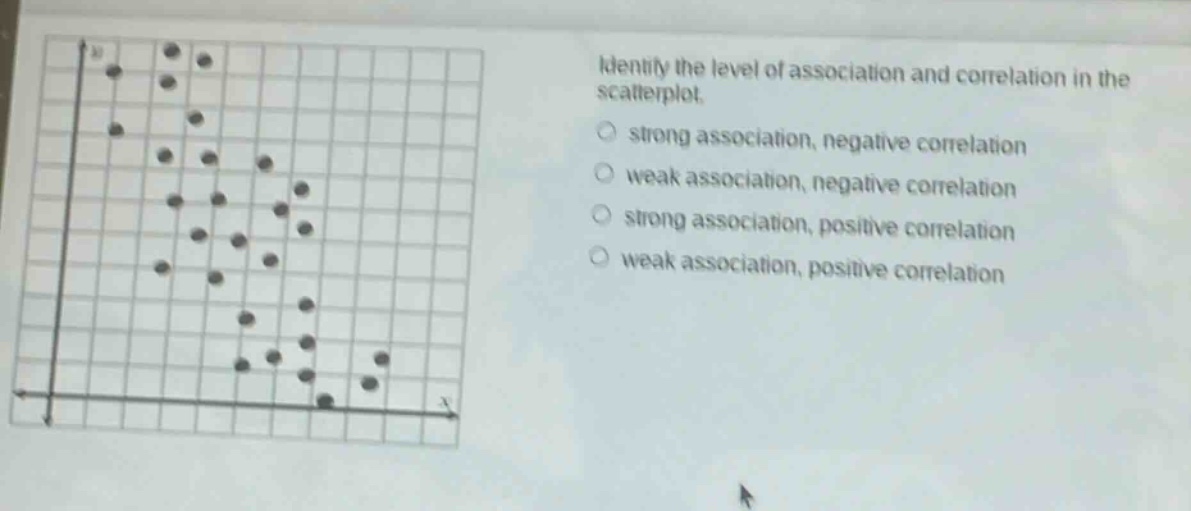
identify the level of association and correlation in the scatterplot. strong association, negative correlation weak association, negative correlation strong association, positive correlation weak association, positive correlation
Answer
Explanation:
Step1: Observe data - point pattern
As x - values increase, y - values decrease. So, it is a negative correlation.
Step2: Check data - point clustering
The data points are not tightly clustered around a line, so it is a weak association.
Answer:
weak association, negative correlation