identifying the correct residual plot\na scatterplot consists of (1, 4.0), (2, 3.3), (3, 3.8), (4, 2.6), and…
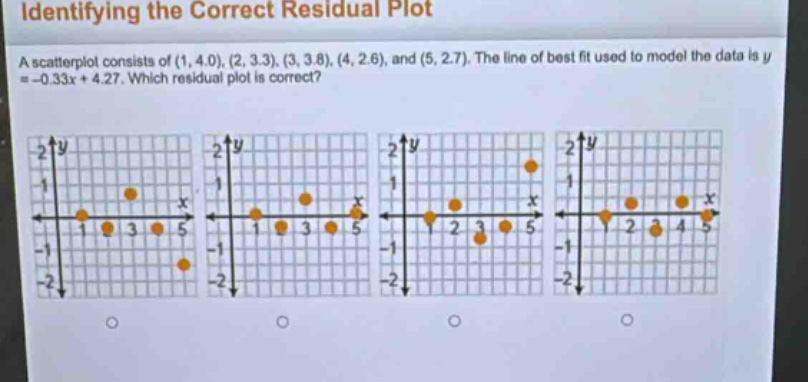
identifying the correct residual plot\na scatterplot consists of (1, 4.0), (2, 3.3), (3, 3.8), (4, 2.6), and (5, 2.7). the line of best fit used to model the data is y = -0.33x + 4.27. which residual plot is correct?
Answer
Explanation:
Step1: Recall residual formula
Residual = Observed - Predicted.
Step2: Calculate predicted values
For $(x = 1)$: $y_{pred}=-0.33\times1 + 4.27=3.94$. Residual $=4.0 - 3.94 = 0.06$. For $(x = 2)$: $y_{pred}=-0.33\times2+4.27 = 3.61$. Residual $=3.3 - 3.61=- 0.31$. For $(x = 3)$: $y_{pred}=-0.33\times3 + 4.27=3.28$. Residual $=3.8 - 3.28 = 0.52$. For $(x = 4)$: $y_{pred}=-0.33\times4+4.27 = 2.95$. Residual $=2.6 - 2.95=-0.35$. For $(x = 5)$: $y_{pred}=-0.33\times5+4.27 = 2.62$. Residual $=2.7 - 2.62 = 0.08$.
Step3: Analyze residual plot
The $x$-values of the residual - plot are the $x$-values from the scatter - plot, and the $y$-values are the calculated residuals. We check which plot has the correct set of points based on our calculated residuals.
Answer:
(No options are provided in the text to choose from. But the above steps show how to calculate the residuals to identify the correct residual plot among given ones.)